Don't buy products from fee-based advisors
Is your advisor a stealth indexer?

Market Update
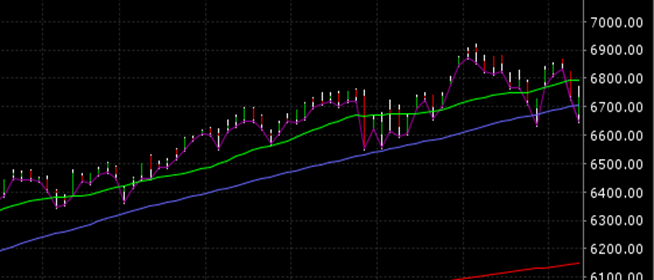
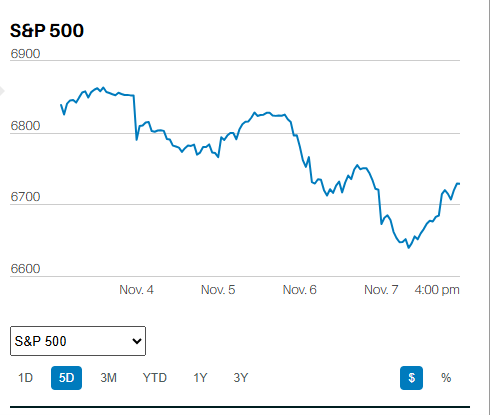
The S&P 500 fell 3.35% last week to finish at 3770.55. The Nasdaq fell 5.65%. The Federal Reserve met last week and raised the Fed Funds rate by 0.75%. It has gone from 0% to 3.75% since March. The last four rate hikes have been by an unusual 0.75% each. The Fed more often raises and lowers rates in 0.25% increments. The Fed is expected to raise the funds rate by either 0.75% or 0.50% in December. The FOMC will see two CPI reports and a jobs report before they meet in mid-December. The futures market has bumped the expected terminal rate to 5%. The terminal rate is the anticipated final rate for the current tightening cycle. A 5% terminal rate implies at least one and more likely two rate hikes in 2023.
The Funds rate is up 4.75% adjusted for inflation, according to MKM Partners’ chief economist Michael Darda. The economist points out there are other indications of financial tightness in the economy as well, according to Barron’s. A continuing decline in commercial bank deposits, a contracting residential real estate sector and an inverted yield curve among them. The 3M/10Yr curve is still inverted, all but guaranteeing a recession within the next 18 – 24 months.
The rate hikes are only part of the financial tightening taking place. The Fed’s balance sheet ballooned to almost $9 trillion from $4.5 trillion during the Covid crisis. We wrote about the equation of exchange last week. MV=PQ where M is the money supply, P is prices, and Q is the quantity of goods and services produced. The Fed created almost $4.5 trillion in monetary base during the pandemic. Monetary base is currency in circulation plus commercial bank deposits held by banks and in the central bank’s reserves. Reserves are used to create more money. Currently, M is increasing slowly, around 2.6% as of October. Prices (P) are increasing at over 8%. The hope is that prices will decline as the Fed shrinks the monetary base. However, it is likely that quantity (Q) will decline as well since a shrinking money supply (M) will drive the cost of money (interest rates) higher. A higher cost of money results in demand destruction. Demand destruction means less goods and services sold.
Solomon Tadesse is the head of quantitative equities strategies North America at Societe Generale. He believes the Fed needs to shrink its balance sheet by $3.9 trillion to bring inflation down to 2%. His model shows that shrinking the Fed’s balance sheet by $3.9 trillion is equal to another 4.5% increase in the Fed funds rate. It’s unreasonable to expect the economy to avoid recession with an effective 9% hike in interest rates. Nor does it seem likely the Federal Reserve will be able to shrink its balance sheet by $3.9 trillion before something breaks. Such a big decline will cause a liquidity crisis in the Treasury market well before the Fed reaches its goal. All of which means the Federal Reserve isn’t going to succeed in driving inflation back to 2%, at least not this cycle. It will likely have to settle for an inflation rate between 3% and 4 % before it is forced to begin another easing cycle.
The bear market in stocks is not over. Norwood Economics expects the bottom to occur sometime next year, likely in the spring or summer. A reasonable target for the S&P 500 is 3,000 to 3,200. We are finding more and more good companies on sale. We are excited about the growing opportunities to buy good companies on sale. We continue to be underweight bonds. We have cash from the sale of five energy companies, three drug companies, and a defense contractor. Norwood Economics will be putting that cash to work in the coming months.
Economic Indicators
The economy continues to grow. The big number last week was the jobs report. Nonfarm payrolls rose by 261,000 in October after rising 315,000 in September. The forecast was for 205,000. The unemployment rate rose to 3.7% from 3.5%. It is still near 50-year lows. About 50,000 young adults enter the workforce monthly, according to Larry Summers. The economy is still creating more jobs than needed to absorb new members of the workforce. Job openings in September rose to 10.7 million from 10.3 million. The Quits rate fell to 4.1 million from 4.2 million. The jobs market remains strong, but it is a lagging indicator.
Unit labor costs in Q3 rose 3.5% after rising 8.9% in Q2. The decline is significant and a positive sign. Cost-push inflation (rising labor costs for instance) is hard to stamp out once started. People come to expect raises every year to offset inflation. It is not an easy expectation to change once ingrained in the worker psyche. Productivity rose by 0.3% in Q3 after falling 4.1% in Q2. It is another good sign. Rising productivity helps businesses control costs. Controlling costs means higher margins and/or less pressure on prices.
A recession is coming regardless of the current economic data. The evidence should start showing up in the numbers by next spring.
What To Look for In an Advisor
A fee-only advisor only charges a fee. The only other expense is the cost of the portfolio. A fee-based advisor charges a fee as well. They also sell their clients products for a commission. The products include loaded mutual funds, annuities, private REITs, and unit trusts. American funds have one of the largest selections of loaded mutual funds. Edward Jones is a big user of loaded funds and a big user of American funds for instance. Fee-based advisors have a conflict of interest because they sell products to clients. Fee-based advisors are often more than double the cost of a fee-only advisor. Always use a fee-only advisor.
Index funds outperform active funds (funds that try to beat a comparable index). The data is overwhelming. The Standard and Poor Index vs. Active (SPIVA) report is published yearly. It is conclusive. From the mid-year 2022 update – “over a 15-year horizon more than 70% of actively managed funds failed to outperform their comparison index in 38 of 39 categories.” Over 20-year periods the underperformance percentage rises to over 90%. The clincher is that funds that do outperform don’t persist in that outperformance. There is no demonstration of skill without persistency of outperformance. Use an advisor that uses index funds if you want to gain exposure to the capital markets through mutual funds and ETFs.
Most financial advisors are stealth indexers. A stealth indexer is an advisor who is pretending to make active management decisions but is really mimicking an index. A portfolio of stocks in which each stock is less than 0.5% of the portfolio value is almost certainly a stealth index portfolio.
Weighting a stock at a 0.25% to 0.5% of your portfolio isn’t meaningful to portfolio performance. A portfolio of stocks in which the average position size is 0.25% to 0.5% makes the portfolio dependent on how the entire market moves. Position sizes must be meaningful for a single stock to provide a meaningful return. Norwood Economics uses 2% to 3% positions sizes depending on the portfolio. We use a 5% weight for our best ideas portfolio. Hire a financial advisor that is going to attempt to earn their active management fee. Otherwise, you should index and avoid paying the active management fee.
Regards,
Christopher R Norwood, CFA
Chief Market Strategist