

Blog
LIKE WHAT YOU'RE READING? JOIN OUR NEWSLETTER TO RECEIVE WEEKLY MARKET UPDATES FROM OUR INVESTMENT EXPERTS

Executive Summary The S&P 500 had its best weekly gain since 2023 due to the suspension of most tariffs The Trade War and tariffs have dominated stock market action Daily announcements on the tariff front have led to high volatility The market is still in a downtrend Tariffs will negatively affect the U.S. economy Rising prices will reduce consumer demand U.S. earnings estimates are coming down; currently $267 and falling Pay attention to what bond investors are thinking The weakening dollar fell to its lowest level since 2022 The U.S. needs foreign capital
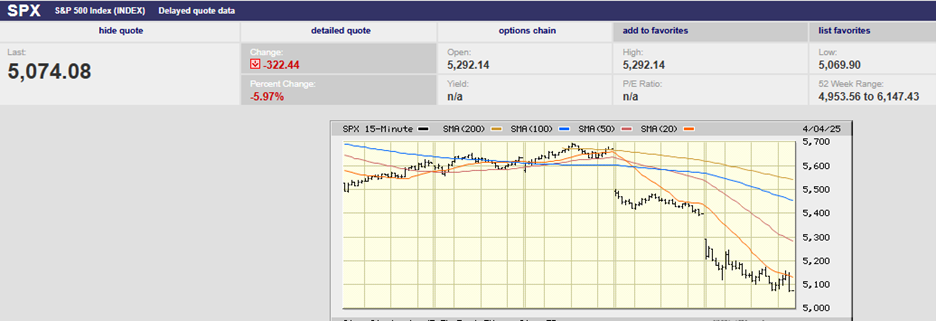
Executive Summary The S&P 500 fell 9.1% and ended the week at 5,074.08 Bond yields are declining as investors flee stocks CME FedWatch tool now forecasts 3 to 4 Fed funds cuts in 2025 Inflation is higher than the Fed’s target and trending in the wrong direction The Volatility Index (VIX) spiked on Friday. Investors are showing fear The Stock Market is due a bear market bounce The longer-term downtrend likely won't end until Trump’s Trade War ends Market strategists are raising the odds of a recession and reducing price targets The Fed has a dilemma. It doesn't have the tools to deal with rising inflation and slowing economic growth simultaneously
Executive Summary The S&P 500 fell 1.5% and ended the week at 5,580.94 The energy & healthcare sectors are the leading gainers year to date The S&P early highs and late lows are a sign of market weakness The fixed income market is signaling higher for longer Mortgage rates seem high to younger home buyers Mortgage rates were higher from 1972-2002 Earnings & GDP growth estimates are coming down The stock market reflects the economy Consumer confidence plunged to a 12-year low The economy is vulnerable to a declining stock market
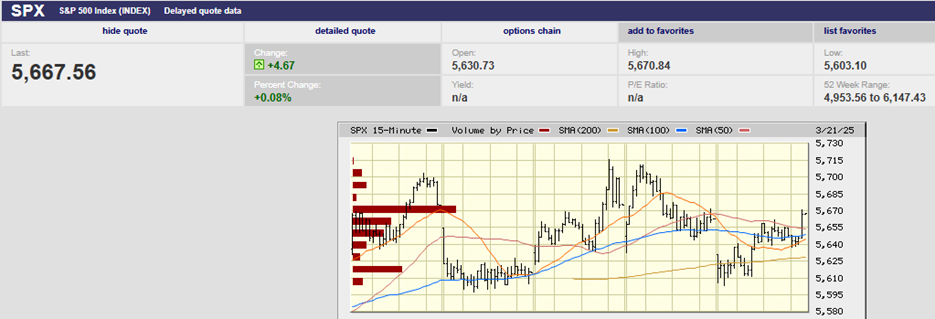
Executive Summary The S&P 500 rose 0.5% last week to finish at 5,667.56 breaking its four-week losing streak The uncertainty surrounding the trade war will weigh on the economy and capital markets for the foreseeable future. Economists and the public aren’t sure whether to worry about inflation, weakening economic growth, or both. The Summary of Economic Projections (SEP) signals two rate cuts and a higher year-end inflation number Invoking the Alien Enemies Act of 1798 will lead to higher prices U.S. stocks are the only asset class losing money in 2025 The Stock Market The S&P 500 rose 0.5% last week to 5,667.56. The Nasdaq rose 0.2% and the Dow was up 1.2%. The S&P broke a four-week losing streak. It was due for an oversold bounce. We wrote last week, “The S&P is primed to bounce this week, likely at least back to the 200-day moving average residing at 5,740.” The S&P did bounce but only reached 5,715.33 on Wednesday around 3 p.m. Fed Chairman Powell was speaking soothing words at the time to investors during his press conference following the Federal Reserve FOMC meeting. The S&P couldn’t build on Wednesday’s late gains though, although it did try.
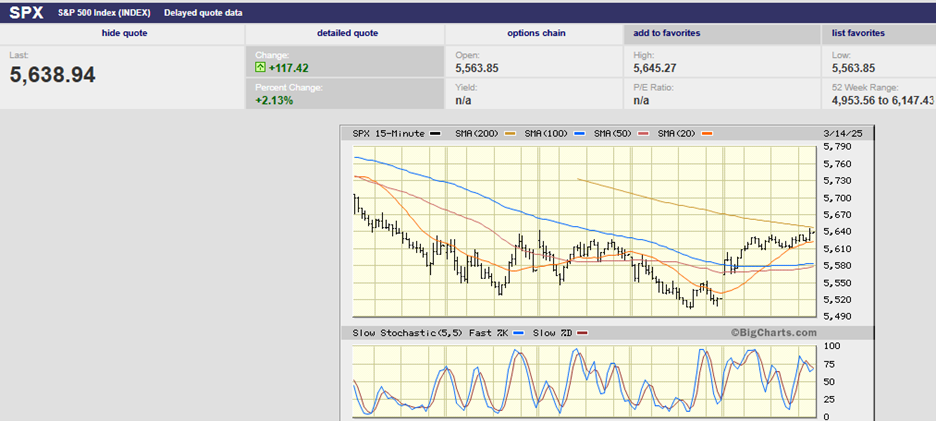
Executive Summary • The S&P 500 fell 2.3% last week to finish at 5,638.94 • The S&P is down 4.13% year-to-date • The Nasdaq fell into correction territory and is down 11.6% since mid-February • Market strategists are saying recession risk is rising • Tariffs hurt the economy • Consumers and small business owners are feeling the pinch • The NFIB Uncertainty Index rose to its second-highest level ever in February • The Trump administration is targeting a lower 10-year Treasury Yield • Interesting Charts below The Stock Market
Executive Summary The S&P 500 fell 3.1% last week to finish at 5,770.20 The S&P closed 50 points above the 200-day moving average on Friday A bearish crossover or a “dark cross” indicates a loss of momentum A correction of 10% or more is increasingly likely Founder of AQR, Cliff Asness makes some important observations Interesting Charts below The Stock Market The S&P 500 fell 3.1% last week to finish at 5,770.20, its worst week since September. The S&P is down 1.9% for the year. Technology (XLK) is down 6.01% year-to-date. Consumer discretionary (XLY) is down 8.33%. The other nine S&P sectors are up on the year, led by Health Care (XLV), which is up 8.51%. Consumer Staples (XLP) is the next best-performing sector, up 5.41%. The 10-year Treasury Yield rose to 4.31% from 4.21% last week. The two-year yield was unchanged at 4.01%.
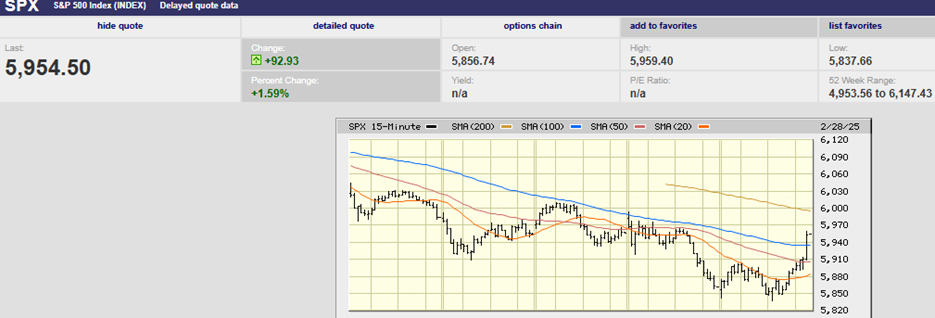
Executive Summary The S&P finished the week at 5,954.50 High government spending has kept the economy growing The S&P has been trading sideways for four months now The Magnificent 7 and technology are out. Healthcare, Financials, Real Estate, and Consumer Staples are in Uncertainty is high Interesting Charts below The Stock Market The S&P 500 lost 1.0% last week, closing at 5,954.50. The Nasdaq fell 3.4% during the week. Treasury yields continued to fall. The 10-year Treasury closed the week at 4.21%. The two-year Treasury yield dropped to 4.01%. The 3-month yield ended the week at 4.34%. The yield curve inverted once more. The 3M/10Yr curve inversion increases the chance of a recession in the next 12-18 months. Of course, the curve was already inverted until last December when it began to normalize. The 3M/10Yr curve last inverted in late October 2022. The period from October 2022 until December 2024 marked the longest continuous stretch of inversion since 1962. And yet no recession materialized, at least it hasn't yet. The lack of a recession in 2023/24 was most likely because of massive fiscal spending. The federal government has run large deficits since the pandemic. Government spending was $6.9 trillion in 2024, almost 25% of GDP. The government's deficit spending has kept the economy growing.
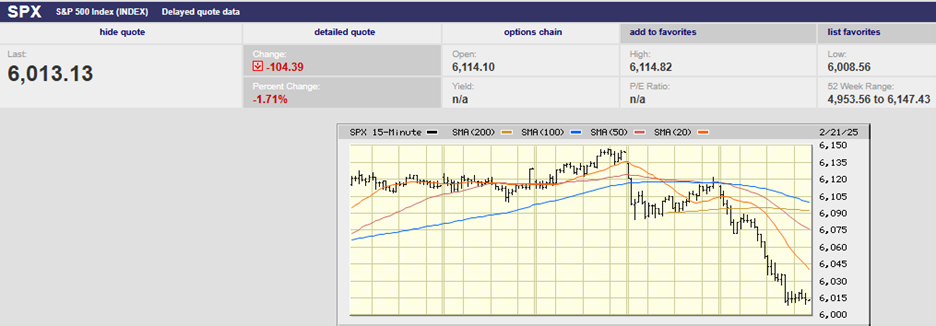
Executive Summary The S&P finished the week at 6,013.13 Volatility is still low despite last week's rise to 18.21 The tech sector is trailing the S&P More stocks are participating in the U.S. stock market gains International & Emerging markets are outperforming the U.S. markets Interesting Charts below The Stock Market
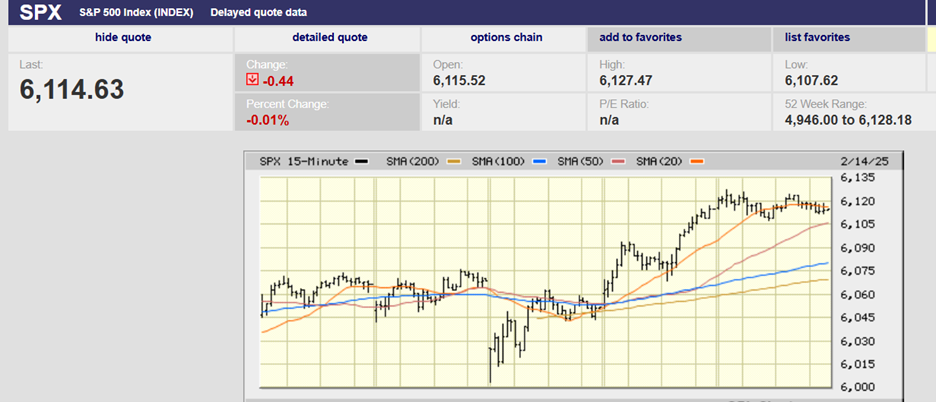
Executive Summary The S&P finished the week at 6,114.69 The 2-year yield hit 4.38% after the Consumer Price Index (CPI) was released on Wednesday, but ended the week at 4.27% Investors dumped stocks when the CPI report was released Producer Price Index (PPI) has accelerated for five straight months PPI is a leading indicator of consumer inflation Inflation expectations are rising among fixed-income investors The 5- &10-year breakevens are rising The Stock Market
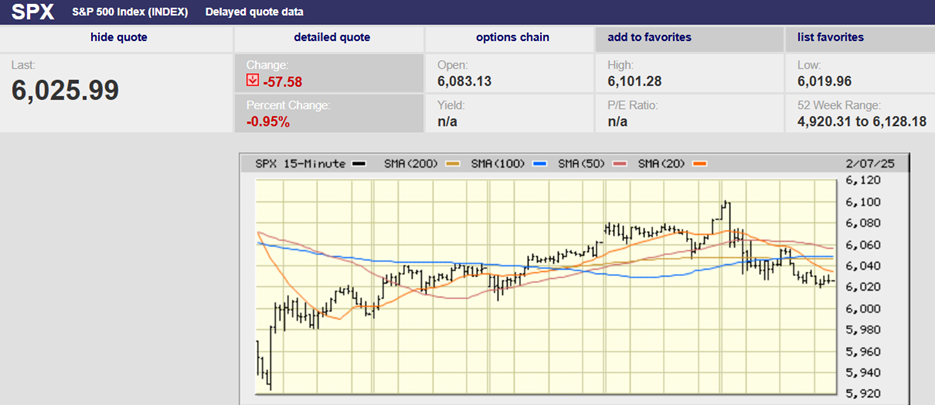
Executive Summary The S&P finished the week at 6025.99 The S&P has been trading sideways since 11 November Volatility (VIX) has spiked five times since last fall each time falling quickly back to mid-teen levels Microsoft, Alphabet, and Amazon have contributed to the negative tone with cautious guidance The Equity Risk Premium has been falling over the last 14 years Bonds have been a horrible investment over the last three, five, and ten years The jobs market continues to show strength Consumers' inflation expectations are increasing The stock market is expensive and will return less than its long-term average over the next decade Good stock picking will be critical if investors are to earn a return close to the long run average. The equity risk premium is too low which may make Treasury bonds a better investment than stocks on a risk adjusted basis over the next decade. Treasury bonds may outperform stocks over the next decade but not necessarily over the next few years since the 10-Year could rise another 100 basis points in the short term. The Stock Market