Executive Summary
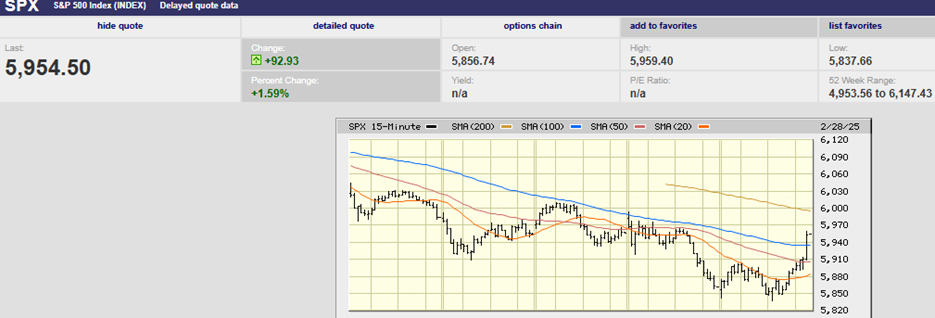
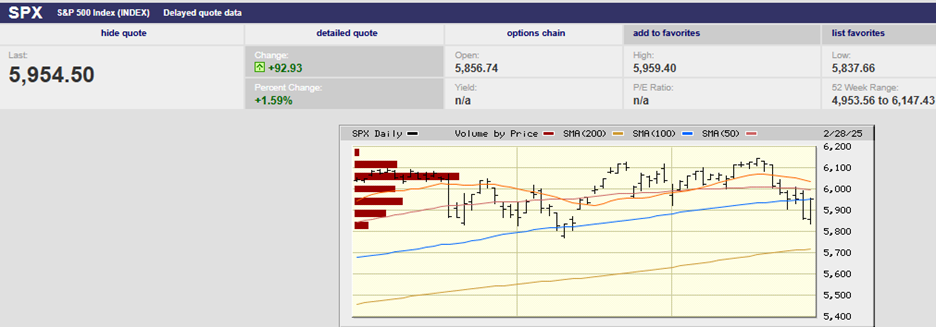
- The S&P finished the week at 5,954.50
- High government spending has kept the economy growing
- The S&P has been trading sideways for four months now
- The Magnificent 7 and technology are out. Healthcare, Financials, Real Estate, and Consumer Staples are in
- Uncertainty is high
- Interesting Charts below
The Stock Market
The S&P 500 lost 1.0% last week, closing at 5,954.50. The Nasdaq fell 3.4% during the week. Treasury yields continued to fall. The 10-year Treasury closed the week at 4.21%. The two-year Treasury yield dropped to 4.01%. The 3-month yield ended the week at 4.34%. The yield curve inverted once more.
The 3M/10Yr curve inversion increases the chance of a recession in the next 12-18 months. Of course, the curve was already inverted until last December when it began to normalize. The 3M/10Yr curve last inverted in late October 2022. The period from October 2022 until December 2024 marked the longest continuous stretch of inversion since 1962. And yet no recession materialized, at least it hasn't yet. The lack of a recession in 2023/24 was most likely because of massive fiscal spending. The federal government has run large deficits since the pandemic. Government spending was $6.9 trillion in 2024, almost 25% of GDP. The government's deficit spending has kept the economy growing.
S&P 500 5-Day Chart
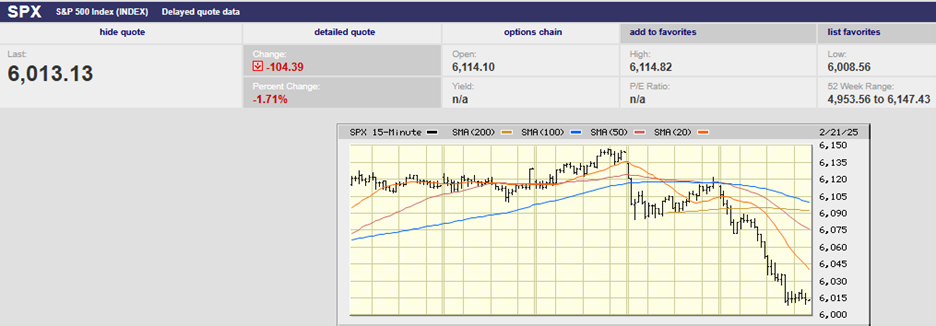
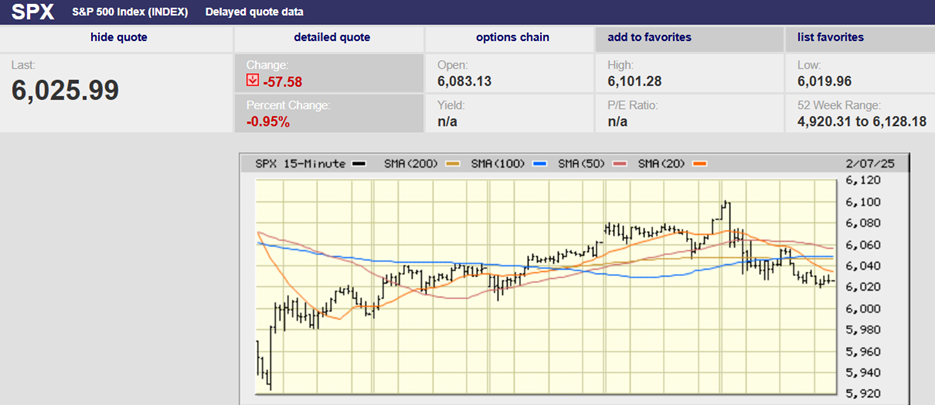
We wrote last week that, “Friday was a straight-down day with a close near the day’s low. Follow-through selling is likely in the week ahead. The index did hold the 50-day moving average. It may provide some support, at least initially, on Monday.” Monday's trading followed the script. The S&P rose in early trading before fading as the day wore on. The selling continued Tuesday morning. By the close Tuesday, the S&P had experienced the worst four-day stretch since last September.
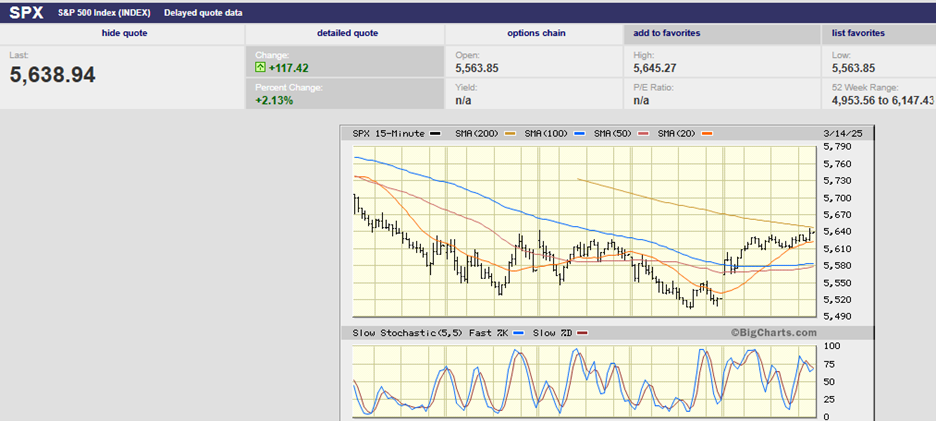
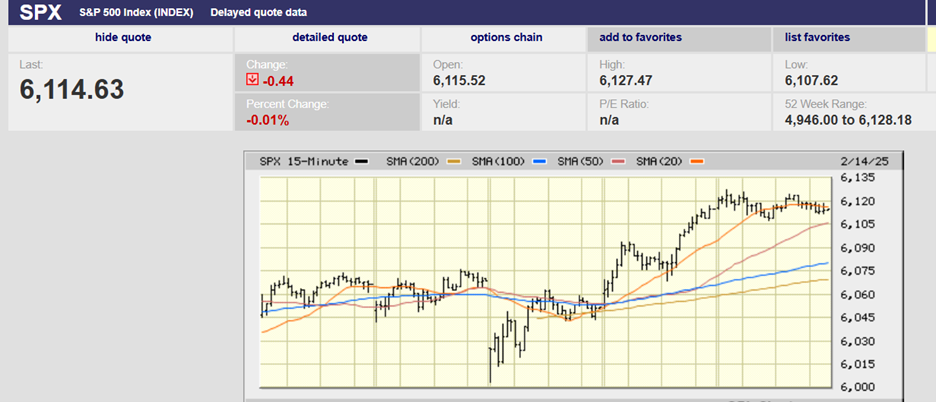
S&P 500 3-Month Chart
Trading was once again mechanical. The algorithms were in control. The market tried to rally back above the 50-day moving average Tuesday but failed (see chart above). It closed at the 100-day moving average. Wednesday the market again tried to take back the 50-day moving average. It failed again, closing once more at the 100-day M.A. Thursday saw support at the 100-day break after the S&P failed a third time to reclaim the 50-day. The S&P closed at its low on Thursday setting up for an ugly Friday…that didn’t happen. A better-than-expected Personal Consumption Expenditure’s index inflation reading Friday saved the day. Or at least that was the media narrative. The trading Friday was a back-and-forth affair until Friday afternoon when the market took off. The entire gain for the day occurred in the last two hours. The PCE report was released before the market opened. It was a mixed report. It likely had little to do with Friday's trading.
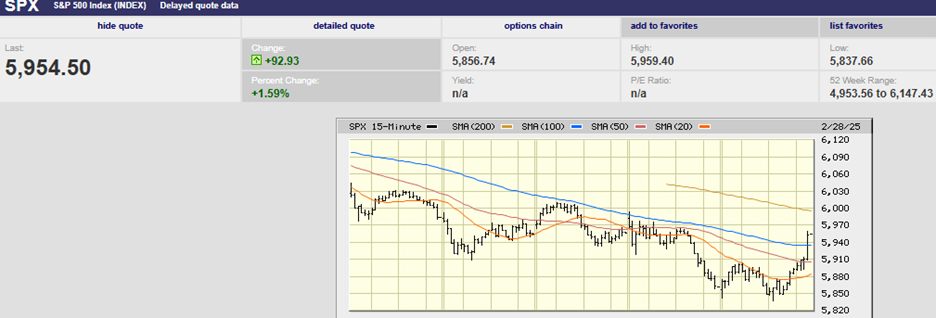
S&P 500 5-Day Chart
Early action Friday saw the S&P rise 1% from around 5,840 to 5,910. Selling came in, knocking the index back to 5,840. That level held though and the computers began to buy once more. The index took off around 2 p.m., climbing 1.8% into the close, including a 0.8% surge in the last half hour. The S&P finished a few points off its high for the day. The bounce, giveback, and second bounce on Friday don't match the PCE narrative.
We might see some early selling on Monday. The trend in the first few days of trading this week is more likely up than down though.
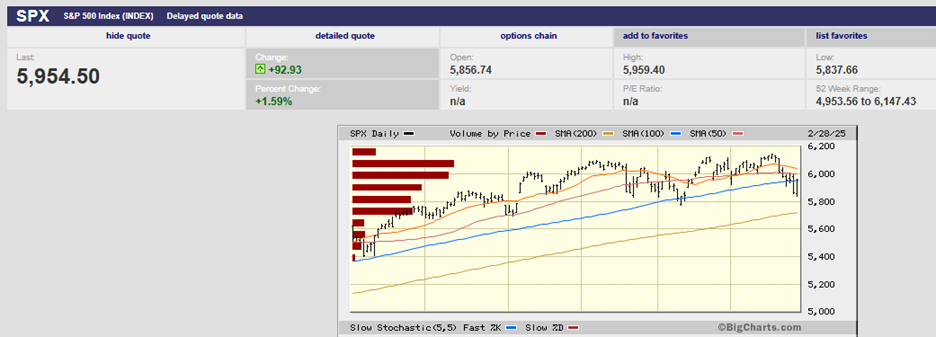
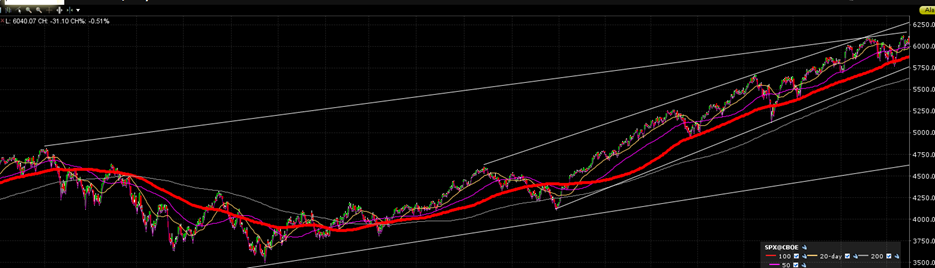
S&P 500 6-Month Chart
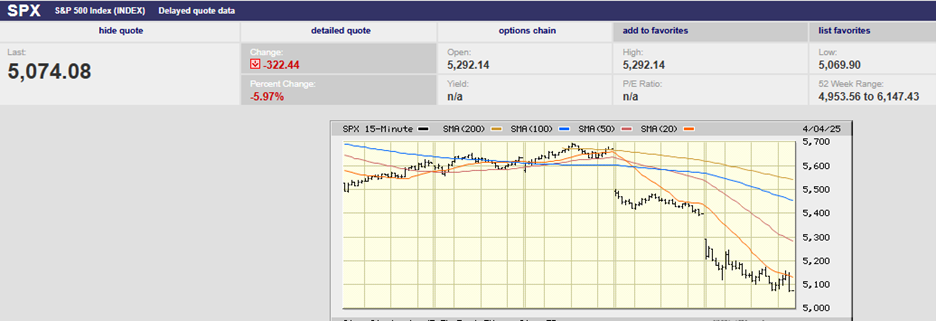
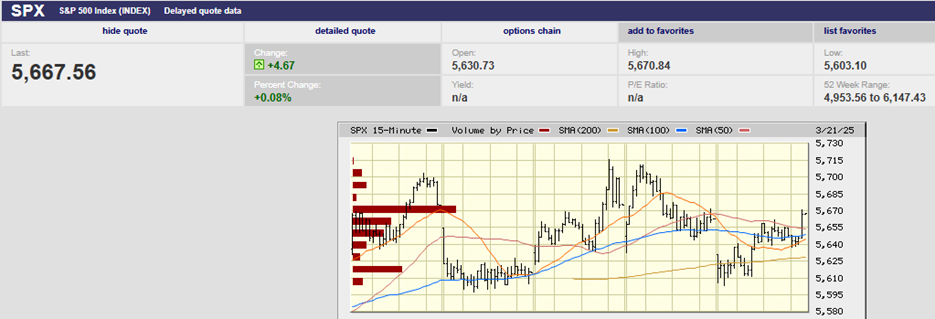
The S&P has been trading sideways for four months now. Resistance is building in the 6,000-6,100 area. (See Volume by Price – Red bars – in the chart above). Failure to break out decisively to a new high in the next few weeks may lead to a bigger pullback. The S&P is off 3.1% since its last record high. A fall to the 200-day moving average at 5,710 wouldn’t be a surprise. It would only be a 7.1% decline, hardly unusual. A bigger decline to 5,400 would also be normal given how far the S&P has come in the last two years. It would be a 12.2% decline, a typical correction. The longer the S&P trades sideways the more likely a bigger pullback will occur. At some point, investors will get impatient. They will decide to book profits if the upside momentum doesn’t resume soon enough. Meanwhile, we continue in a trading range market with trading between 5,800 and 6,100.
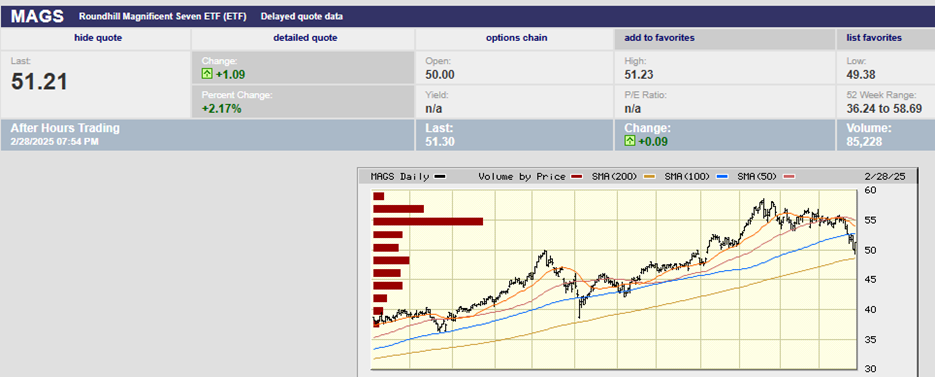
It is a very different market underneath the surface though. The two-year concentrated advance lead by the Magnificent Seven is a thing of the past. The MAGS ETF is down on the year.
MAGS 0ne-Year Chart
The new narrative continued last week. The Magnificent 7 and technology are out. Healthcare, Financials, Real Estate, and Consumer Staples are in. It may be dawning on investors that the new administration’s policies aren’t a positive for the economy. Government spending cuts, fewer immigrants entering the workforce, and tariffs mean job losses and lower economic growth. They also mean fewer passive 401k capital flows into the market.
“From its January peak, Bitcoin is -16.2%; semiconductors (SMH) are -9%; the tech-heavy Nasdaq is down 5.7%; the small-cap Russell 2000 is -10% - and still below where it peaked in September 2021; the Dow Transports Index is also -10%; the Dow Industrial Index is -3%; and the S&P 500 and Canada’s TSX are both down about 2.5%.” Danielle Parks, CFA Feb 26
Parks went on to write in a note, “As well, cyclical sectors are in full panic mode, with the S&P 500 Homebuilders index down 32%, the auto sector down 29%, and Oil (WTIC) down 14%. For now, at least, fears of disappointing growth and earnings have overcome fears of inflation.”
From the Associated Press Tuesday, February 26th, “The S&P 500 Consumer Discretionary sector index fell 1.9% during afternoon trading. It’s lost more than 4% this year, the worst-performing sector in the S&P 500 in 2025. The benchmark itself has risen ~1.2%.” Meanwhile, consumer staples (XLP) are up 5.69% through Friday. Healthcare (XLV) is up 8.26% and Financials (XLF) is up 7.97&. Technology (XLK) is down 3.01%. “The outperformance of defensive and bond-sensitive stocks is starting to signal a downshift in economic activity, posing a risk of “disruption” in the equity bull market,” Bank of America Strategist Michael Hartnett wrote last week.
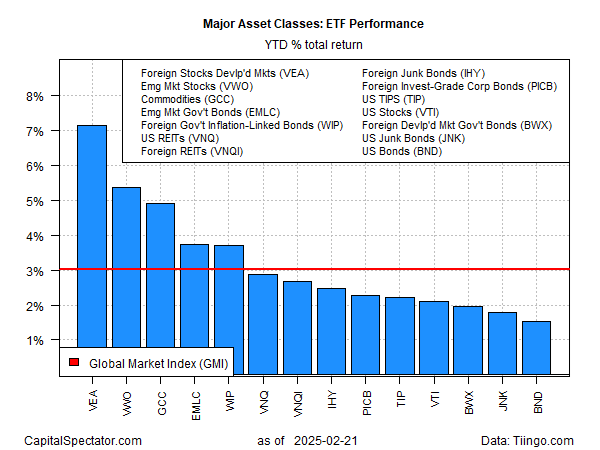
International and emerging market stocks continue to outperform the U.S. (chart above). Commodities, foreign bonds, U.S. and foreign real estate, and U.S. inflation-protected bonds are all outperforming U.S. stocks. (chart above).
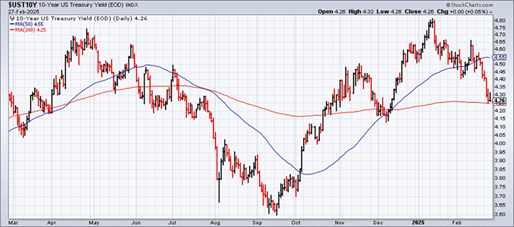
U.S. Treasury bonds have been rallying, with the 10-year U.S. Treasury price up 5.2% since December 1. This has brought the 10-year yield down from 4.8% to 4.21%, the lowest since December 12, 2024. Bond investors may be sniffing out a slowing economy. It would explain why inflation fears seem less threatening to them than a month of two ago.
The latest Atlanta Fed GDPNow reading for the first quarter did nothing to ease the concerns of a slowdown. It fell from 2.3% to negative 1.5% on Friday. A large decline in net exports was the main culprit. Front-running tariffs may be the explanation. Regardless, the GDPNow forecast is for a negative first-quarter GDP number. “The nowcast of the contribution of net exports to first-quarter real GDP growth fell from -0.41 percentage points to -3.70 percentage points while the nowcast of first-quarter real personal consumption expenditures growth fell from 2.3 percent to 1.3 percent,” according to the Atlanta Fed.

Personal income rose by 0.9% in January, well above the 0.4% forecast. Meanwhile, personal spending fell to minus 0.2%. For comparison personal spending rose 0.7% in December. The forecast was for a gain of 0.1% in January. So, a strong income but weak spending number. A reasonable explanation would be declining consumer confidence. When consumers lose confidence, they save instead of spending. The Conference Board’s consumer confidence index did indeed fall in February. The index dropped from 105.3 to 98.3, well below the expected 102.3
Real PCE is down at an annualized pace of 0.5%. The weak January numbers could be the start of a significant slowdown in the U.S. economy. Remember the 3M/10Yr Treasury curve inverted on Wednesday. But a significant slowdown is far from certain. The weak January figures came after strong fourth-quarter spending. December in particular saw strong spending. Also, the January number may have been affected by worse-than-usual winter weather. Let’s leave it as too early to tell if January's weakness is the start of a trend.
Meanwhile, inflation seems to be moving lower, or perhaps not. The core PCE number fell to 2.6% from 2.9% on a year-over-year basis. That’s great news. However, the one-month number showed a rise of 0.3% for both the headline and core numbers. The monthly number annualized is 3.7%. That’s not-so-great news. Any one month’s data can be volatile, and analysts (including those at the Fed) prefer to look at the trend. The trends are heading up not down, unfortunately.
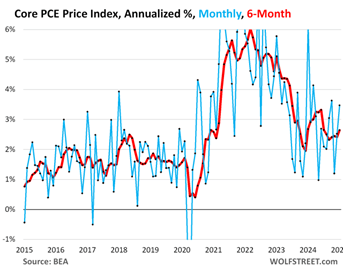
Core PCE is rising on an annualized monthly, 6-month basis. It accelerated to 2.6%, the biggest increase since July 2024.
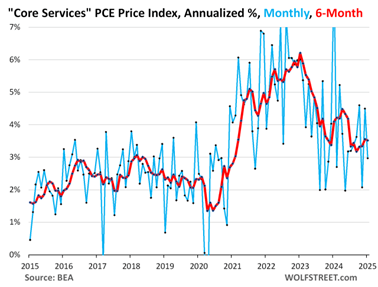
Core services PCE is also rising on an annualized monthly, 6-month basis. Services include labor.
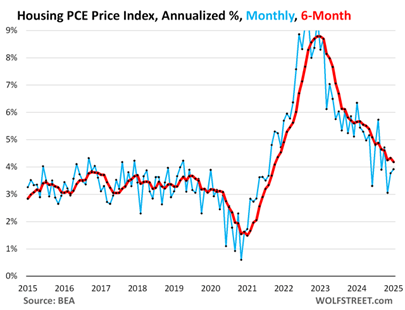
The PCE price index for housing, part of core services, rose by 3.9% in January from December. It is the second month of acceleration in a row although the six-month index decelerated to 4.2%.
So maybe inflation is continuing to decline, maybe it isn't. The jury is out. The unequivocal bad news is seen in consumer expectations. The latest University of Michigan and Conference Board data showed that consumer inflation expectations rose dramatically in February. The University of Michigan saw the 1-year inflation expectation increase to 4.3% from 3.3%. The conference board's consumer confidence 1-year inflation expectation rose to 6% from 5.2%.
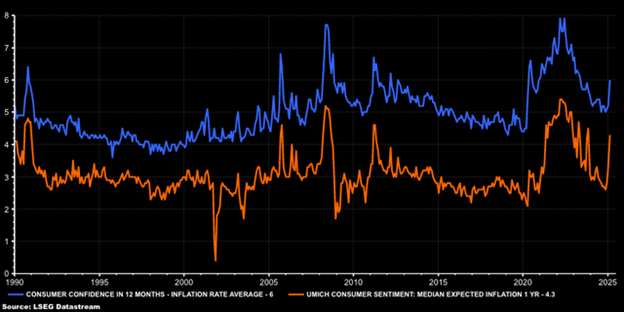
It’s important to remember that consumer inflation expectations impact actual inflation. It’s hard to imagine the Fed cutting rates anytime soon with inflation expectations rising sharply.

The swaps market is also signaling higher inflation expectations (the chart above shows the 1Y, 2Y, and 5Y trends)
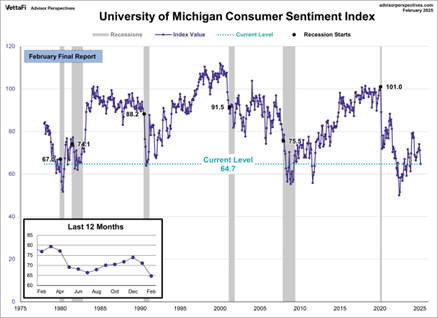
Consumer confidence is wavering even as inflation expectations are rising. “Pessimism about the future returned,” the Conference Board said Tuesday pointing to its February survey. The U.S. Consumer Confidence Index dropped by the most since August 2021.
It is understandable why the stock market has spent the last four months moving sideways. Uncertainty is high. The economy is growing but perhaps slowing. Consumer confidence is weakening. Inflation expectations are rising. Monetary and fiscal policy are shifting. Geopolitics and trade policy are only adding to investor confusion.
Stay tuned for an interesting 2025.
Interesting Charts
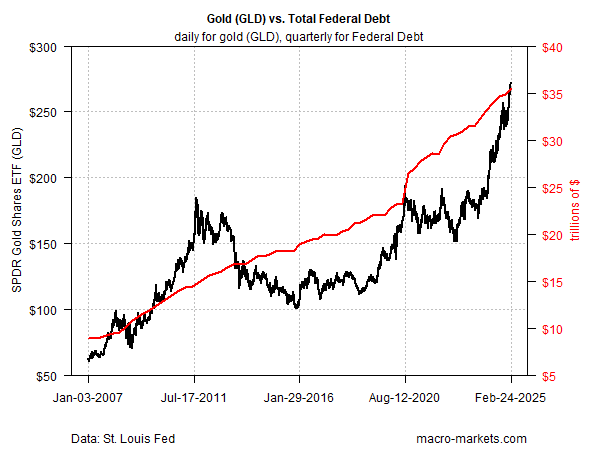
Explains gold’s move higher?
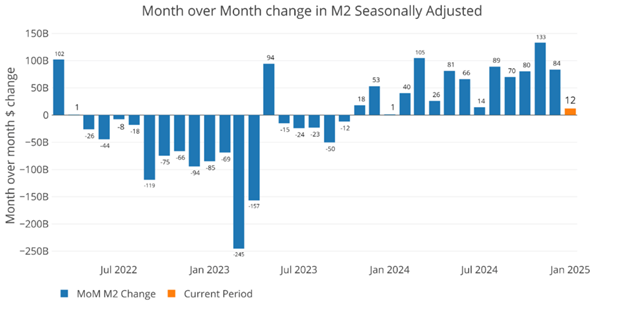
Less fuel for the economy
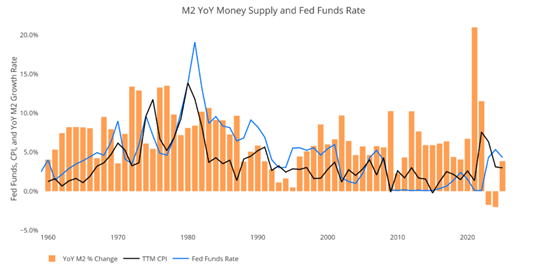
Money, the FFR, and CPI, clearly connected

Technology is expensive
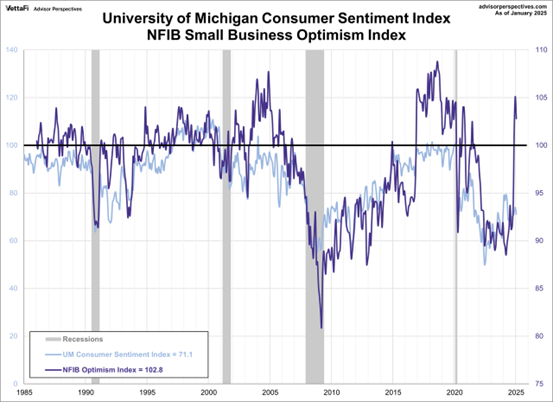
The NFIB Optimism Index and consumer sentiment will converge. It’s just a question of how.
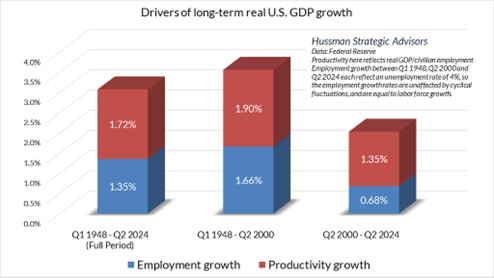
Employment growth and Productivity gains are all that matter over the long run. Everything else is noise. GDP growth of around 2% is all the U.S. can muster. Notice that employment growth is only 0.68% over the last 24 years.
Regards,
Christopher R Norwood, CFA
Chief Market Strategist