INFLATION IS ALREADY BITING
December 14, 2019
Emoji Button — Fishers, IN — Norwood Economics

YIKES!

INFLATION IS ALREADY BITING

MARKET UPDATE

The market went up again. It’s getting boring, monotonous, and frankly, a little too one-way for my comfort. But, hey, the Federal Reserve, Bank of Japan, and ECB are now shoving $100 billion monthly into the financial system. The liquidity must go somewhere. Someone must hold the cash. How much cash does someone need though? Let’s buy, buy, buy assets with that cash. Stocks, bonds, real estate, commodities, and collectibles will return more than zero yielding cash, right? How much liquidity is $100 billion monthly? The world economy is around $85 trillion. One hundred billion monthly is $1.2 trillion annually or about 1.4% of economic activity worldwide. Except with a fractional reserve banking system in place in Japan, the EU, and the U.S. the potential for credit creation expands by a factor of ten. Cheap credit leads to all sorts of excesses eventually – think the internet and housing bubbles for instance.


Time to party like it’s 1999 because, hey, what could go wrong?


Officially the S&P 500 rose 0.7% to 3168.8 last week. It’s up about 26% on the year and around 54% over the past five years. It’s up about 188% over the last decade but only 102% since March of 2000. Doing a little math gives us 5.4% annually, excluding dividends, or about 7.4% with dividends since 2000. The very long-run real return for the S&P 500 is approximately 6.51% since 1871. Add back inflation of around 3.5% ( the post-World War II average) and you get the 10% long-run return that is commonly thrown around as the expected return for the stock market (often as if it were an inviolate birthright of all Americans smart enough to invest in stocks).


The major problem with plugging a 10% stock return into your retirement plan is that it’s only a long-run average and not the number you’re likely to experience during your retirement. Let’s back up and take a closer look at the 7.4% annual return (including dividends) that we’ve experienced over the last almost 20 years. Not bad but not 10%. Furthermore, we haven’t had a bear market in over 10 years. One is coming; we just don’t know exactly when. A run of the mill bear market will take the S&P 500 down by 20% to 30%. The last two bear markets saw declines of 50% or more; it took the market over five years to make back the losses from the last one. Pencil in a much more run of the mill 30% decline and, being generous, assume it starts from 3500 on the S&P 500 (10.5% higher than now). A 30% decline takes us down a very painful 1050 points on the S&P 500; all the way back to 2450 (which just happens to be fair value based on 2020 earnings estimates). By the time the S&P 500 falls to 2450, it’ll have only gained 56% since March of 2000. Pick a year (2020, 2021, 2022) and divide. Best case the market bottoms in 2020, giving the S&P 500 an annualized gain of 2.8% over twenty years. Using 2022 for the bottom gives you a 2.5% annual return since 2000. Throw in a 2% average dividend and you’re still only to 4.5%; nowhere near the 10% you were expecting.


Does anybody want to guess what’s happened to those poor folks who retired in 1999, the ones who based their retirement on earning 10% annually in the stock market? You might have seen a few of them greeting customers at Wal-Mart.

INFLATION IS ALREADY BITING

Inflation is a hidden tax on savers and creditors. Inflation transfers wealth to debtors. Retirees typically have social security as their only guaranteed source of income in retirement unless they use some of their retirement savings to purchase a low-cost fixed annuity. Of course, the guaranteed income from the annuity is only as good as the balance sheet of the insurance company that sold the annuity. It’s true that social security has a cost of living adjustment, but it’s also true that the COLA is not enough to keep up with real out-of-pocket inflation. Just ask someone who’s been collecting social security for twenty odd years and see what they say. There is no cost of living adjustment for private annuities.


All of this means that even mild inflation of 2% annually over a 20 to 25-year retirement is problematic. A 2% inflation rate is the equivalent of an almost 40% purchasing power decline in retirement over 20 years. Two percent happens to be the Federal Reserve’s goal these days. Long gone is the price stability mandate, or at least the mandate as we knew it. Now price stability equates to 2% annual price hikes.


Inflation has already been redefined by our government. It changed the yardstick back in 2007. No longer does it use the Consumer Price Index (CPI), which was designed to measure the actual cost of goods and services purchased by a typical American family. Now the Fed uses something called the Personal Consumption Expenditure Index (PCE). The thing to know about the PCE is that it runs consistently lower than the CPI. Whereas the PCE index has rested below 2% for most of the last decade and currently registers a mere 1.6%, the Atlanta Fed’s Sticky-Price CPI, which is a weighted basket of items that change price relatively slowly, is running at 2.8%. It’s been above 2% since mid-2014. The divergence in PCE and CPI largely can be explained by how healthcare and housing prices are treated, says Peter Boockvar, chief investment officer at Bleakley Advisory Group in Fairfield, N.J.


The short explanation is that the PCE doesn’t use prices paid by consumers when measuring healthcare and housing. It uses Medicaid and Medicare reimbursement rates for healthcare, which are well below what consumers pay out of pocket. The PCE also uses imputed housing costs based on estimates of what a home would cost a renter, rather than actual home prices paid by actual homeowners. The upshot of all of this is that real inflation, the kind that impacts peoples pocketbook, is already likely above 2% and almost certainly destined to stay there for some time to come since the Fed announced last week that it intends to keep interest rates low until the PCE is above 2% for a sustained period. Yikes!


Regards,


Christopher R Norwood, CFA


Chief Market Strategist
By Christopher Norwood July 7, 2025
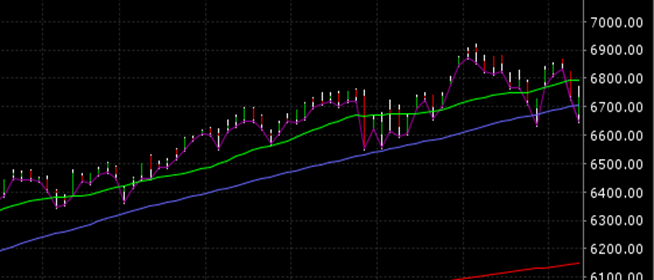
Executive Summary The S&P 500 rose 1.7% in a holiday-shortened week, finishing at 6,284.65 Volatility continues to fall from its elevated levels in early April The S&P is up 6.76% year-to-date. Industrials are leading the way, up 13.40% Price determines returns when buying an asset  Diversify away from a concentrated U.S. large-cap stock portfolio Job growth has been holding steady for almost a year now Analysts have been raising earnings estimates recently 90-day tariff suspension ends on Wednesday The Stock Market The S&P 500 rose 1.7% in a holiday-shortened week. The Nasdaq rose 1.6%. Both indexes set new record highs with the S&P reaching 6,284.65 on Thursday afternoon. The jobs report out Thursday spurred the S&P higher. The index gapped up at the open, closing Thursday up 0.83% (see chart below). The S&P 500 is up 26% from the selloff low on April 8, while the Nasdaq has surged 34.9%.
By Christopher Norwood June 30, 2025
Executive Summary The S&P 500 rose 3.4% last week, climbing to 6,173.07 The Magnificent 7 are outperforming the S&P 493 by over 18% since April The Cboe Volatility Index (VIX) fell as low as 16.11 last week Investors seem unconcerned about tariffs and war Treasury interest rates are starting to fall The Fed has little reason to cut if unemployment isn't moving higher The stock market is at record highs Corporate bond spreads are tight, meaning credit is abundant The dollar has fallen by around 10% in 2025 Inflation is expected to move higher because of tariff The Stock Market The S&P 500 rose 3.4% last week. The Israeli-Iranian ceasefire was credited with the surge to the upside. The index had lost 0.7% over the prior two weeks.
By Christopher Norwood June 23, 2025
Executive Summary The S&P 500 gained 0.3% last week, climbing to 5,967.84 The index is having trouble staying above 6,000 Technical indicators are turning somewhat negative The Federal Reserve kept the overnight rate at 4.25% - 4.50% The updated “dot plot” shows a divided Fed Seven members indicate no rate cuts in 2025 Eight members forecast two rate cuts in 2025 The Fed is forecasting a slower economy in 2025 and 2026 The hard data is starting to point to a slowing economy Inflation is still well above the Fed’s 2% target
By Christopher Norwood June 16, 2025
Executive Summary The S&P 500 fell 0.4% last week to finish at 5,976.97 Friday's sell-off due to Israel's attack on Iran The Volatility Index (VIX) is rising due to the war in the Middle East Higher volatility is usually associated with a down move in the market There is no chance of a Fed Funds Rate cut at this week’s meeting according to the CME FedWatch Tool The unemployment rate has been rising slowly The dollar continues to weaken The U.S. needs to reduce its spending to avoid a currency crisis  The Stock Market
By Christopher Norwood June 9, 2025
Executive Summary The S&P 500 rose 1.5% last week to finish at 6,000.36 The May payroll number came in above estimates The U.S. economy is slowing, despite the S&P 500 poking above 6,000 The Labor Force Participation Rate fell to 62.4% from 62.6% Inflation may have bottomed and is set to rise The services price paid index is pointing towards a higher CPI The declining dollar is a concern Tariffs are a tax The Q2 nowcast seems to be indicating that negative economic impacts from tariffs won’t affect Q2 International markets have far outperformed U.S. markets so far in 2025 The Stock Market The S&P 500 climbed 1.5% last week and closed at 6,000.36. The Dow rose 1.3% while the Nasdaq rose 2.0%. Interest rates rose as bond prices fell. A stronger-than-expected jobs report on Friday is getting the blame for rising yields. The jobs report was also responsible for the S&P’s gap-up open on Friday (chart below).
By Christopher Norwood June 2, 2025
Executive Summary The S&P 500 rose 1.9% last week to finish at 5911.69 The S&P 500 rose 6%, the Dow rose 3.8% and the Nasdaq climbed nearly10% in May Could see another test of support around 5,800 this week Several longer-term negative divergences may be pointing to a tough summer Declining new highs during an advancing market is a negative Earnings estimates for 2025 and 2026 have been trending lower Earnings drive the stock market over the long run
By Christopher Norwood June 2, 2025
Executive Summary The S&P 500 fell 2.6% last week to close at 5,802.82. The 20-Year Treasury auction went poorly. The yield rose above 5%. The 5% threshold has twice this year resulted in the administration adjusting its stance on tariffs. (Make that three times as Trump over the weekend gives the U.K. until July 9 th .) Longer-term inflation expectations are rising. Moody’s downgraded the U.S. to Aa1 on 16 May. The credit default swaps market sees the U.S. as a Baa1/BBB+ credit, on par with Greece. The tax cut bill will add to the deficits and debt. Long-term interest rates might well continue to rise.
By Christopher Norwood May 19, 2025
Executive Summary The S&P 500 rose 5.3% last week to finish at 5,958.38 The Dow advanced 3.4% and the Nasdaq added 7.2% A falling VIX means investor confidence is increasing A 90-day pause in the trade war sent the S&P higher Earnings estimates are falling along with GDP growth forecasts Earnings and interest rates drive the stock market over the long run Investors are chasing performance Small business hiring plans and job openings haven’t improved Norwood Economics continues to look for good companies on sale The Stock Market
By Christopher Norwood May 19, 2025
Executive Summary The S&P 500 fell 0.5%, to finish at 5,659.91 The Dow fell 0.3%, and the Nasdaq dropped 0.5% The 200-day moving average is the next resistance U.S. nominal GDP growth expected to slow significantly Bank of America shifts investment focus Norwood Economics already has exposure to gold for most clients Norwood Economics is overweight international stocks The risk of both higher unemployment and higher inflation has increased The Federal Reserve declined to lower the fed funds rate last week The Stock Market
By Christopher Norwood May 5, 2025
Executive Summary The S&P 500 rose 2.9% last week to finish at 5,686.67 The Dow was up 3% last week, and the Nasdaq rose 3.4% The counter-trend rally is ongoing Investors are extremely bearish due to worries about the trade war Political prediction markets are back Exploding imports are not a sign of weakening demand The April jobs report was better than expected The Trade War continues Capital is flowing into international and emerging markets The US dollar will likely continue to weaken The Stock Market
More Posts