Plan for the Golden Years
Christopher Norwood • May 15, 2023

It helps to ask questions 

Market Update

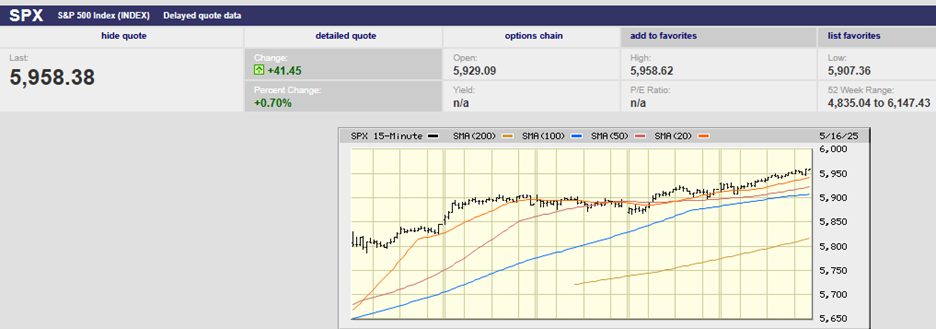
The S&P 500 lost 0.29% last week to finish at 4124.08. The Nasdaq gained 0.40%. It is the sixth week in a row that the market moved less than 1% in either direction. In fact, the S&P spent the entire week trading between 4,098.92 and 4,154.28. The VIX fell to 17.03, near its 52-week low of 15.53. Periods of low volatility are followed by periods of high volatility. High volatility is associated with declining markets. Low volatility can last for years though, which makes it a questionable timing tool.


The debt ceiling debate might be the catalyst for higher volatility. Secretary of the Treasury Janet Yellin says the government will run out of money by the first of June. It’s widely believed that the actual date will be near the end of June, according to the news media.

Regardless, the bond market has begun to react to the possibility of default. Four-week Treasury bills auctioned Thursday sold at a yield of 5.723%. The eight-week T-bill sold at a yield of 4.793% in the same auction. The higher four-week yield was due to investors’ fear of default, according to Barron's. A default could mean not getting paid on time. Stocks might get hit in the next few weeks as well if equity investors begin to worry. The protracted debt-ceiling battle in 2011 saw the S&P 500 fall more than 19%.


Congress may find that the bond market has had enough of profligate spending. It wouldn’t be the first time that the bond market imposed fiscal discipline on the U.S. Congress. The Congressional Budget Office (CBO) is estimating a deficit of $1.5 trillion in 2023. That’s about 6.5% of GDP and far above the country’s sustainable growth rate. It matters because debt growing faster than the economy isn’t a sustainable trend. Congress has been able to run huge deficits for over a decade because debt servicing costs haven’t risen. Debt servicing costs haven’t risen because of falling interest rates. Rates stayed at or near zero for most of the period between 2008 and 2021. Congress was able to cut taxes and boost spending with no rise in the cost of debt financing as a result. That has changed.


Strategas wrote recently that, “The free lunch is over.” The Macro Institutional Research firm pointed out in a recent note that debt-servicing costs are rising for the first time in 40 years. Interest payments accounted for 12.7% of tax revenue in April, up from 11.7% a year ago. The bond market has a history of imposing fiscal discipline when net interest costs exceed 14% of revenue, according to Strategas. “I want to be reincarnated as the bond market because you can intimidate everybody,” James Carvelle famously said during the Clinton presidency. That quote may get a lot of airtime by the media in the next few years. The bond market vigilantes of the 1990s are likely to ride again if Congress doesn’t get its spending under control. It will be bad for bonds and stocks if that happens. Meanwhile, it will be bad for stocks and bonds if the U.S. does default in the next few months.


Economic Indicators

The Consumer Price Index rose 0.4% in April, matching the March increase. Core CPI rose 5.5% year-over-year down from 5.6%. The Sticky Price Consumer Price index fell to 6.32% in April from 6.45%. Inflation is receding but slowly.


The latest 12-month decline in M2 is the fastest pace since 1934, according to Dr. Lacy Hunt of Hoisington Asset Management. Hunt goes on to point out that the rapid rise in the velocity of money has kept inflation from falling faster. Velocity bottomed out at 1.112 in Q2 of 2020. It has risen to 1.258 as of Q1 of 2023.


He expects the rise in velocity will slow as business conditions worsen. Dr. Hunt also expects business conditions to worsen as credit conditions tighten. A more restrictive fiscal policy will also reduce demand. The country can’t keep running $1.5 trillion deficits, growing debt by 6.5% of GDP yearly. Spending growth will have to slow and that is contractionary.


Initial jobless claims rose to 264,000, up from 242,000 the week prior. The trend continues up. Continuing claims also climbed to 1.81 million from 1.80 million. Consumer sentiment fell in May to a six-month low. The preliminary reading of 57.7 was down from 63.5 in April. Current conditions fell by 3.7 points. Expectations of future conditions fell by 7.1 points to 53.4. Inflation and debt default worries were said to be weighing on consumers. Real weekly wages fell 1.1% in the 12 months through April, according to the Bureau of Labor Statistics. Peoples' paychecks are not going as far.


The economy should fall into recession later this year or early next. M2 is contracting at a 4.43% rate. It is the first contraction in money supply since the 1930s. The velocity of money should slow as tightening monetary and fiscal conditions impact demand. Tightening credit and reduced government spending will push the economy into recession. It is only a question of when.


Questions from 401(k) Participants

Norwood Economics provides education on the economy and capital markets to its 401(k) plan clients. We had several presentations last week. There were lots of good questions from the audience.


Yes, you can contribute to your IRA as long as you’d like. There is no more age limit.


Yes, you can contribute to your 401(k) as long as you’re working and don’t own at least 5% of the company.


No, you can’t contribute $22,500 to both a pre-tax and after-tax 401(k) account. The total of those contributions can’t exceed $22,500. The catch-up provision for those 50 and older is now $7,500.


Yes, you can save in other accounts besides your 401(k) account. You may not be able to make a deductible IRA contribution if you’re covered by a 401(k) plan at work. Married filing jointly status allows you to make a pre-tax contribution until your modified adjusted gross income (MAGI) reaches $116,000. The deduction phases out when your MAGI reaches $136,000.


Yes, you can make a Roth IRA contribution as long as your MAGI doesn’t exceed $218,000. It phases out by $228,000.


The IRA contribution limit for 2023 is $6,500. It is $7,500 if you are 50 or older.


No, the Roth contribution limit and income limit do not apply to a 401(k) plan contribution. A participant can contribute up to $22,500 ($30,000 if 50 or older) in after-tax contributions regardless of their income.


Fidelity estimates that you need to save at least 15% of your household income during your working years to maintain your lifestyle in retirement. Fidelity’s estimate assumes you invest the savings in an age-appropriate portfolio of stocks, bonds, and real estate during your working years.


A successful retirement doesn’t just happen. It takes planning. Make sure you spend time planning for a successful retirement. It will increase your chances of having one.


Regards,


Christopher R Norwood, CFA


Chief Market Strategist


By Christopher Norwood June 30, 2025
Executive Summary The S&P 500 rose 3.4% last week, climbing to 6,173.07 The Magnificent 7 are outperforming the S&P 493 by over 18% since April The Cboe Volatility Index (VIX) fell as low as 16.11 last week Investors seem unconcerned about tariffs and war Treasury interest rates are starting to fall The Fed has little reason to cut if unemployment isn't moving higher The stock market is at record highs Corporate bond spreads are tight, meaning credit is abundant The dollar has fallen by around 10% in 2025 Inflation is expected to move higher because of tariff The Stock Market The S&P 500 rose 3.4% last week. The Israeli-Iranian ceasefire was credited with the surge to the upside. The index had lost 0.7% over the prior two weeks.
By Christopher Norwood June 23, 2025
Executive Summary The S&P 500 gained 0.3% last week, climbing to 5,967.84 The index is having trouble staying above 6,000 Technical indicators are turning somewhat negative The Federal Reserve kept the overnight rate at 4.25% - 4.50% The updated “dot plot” shows a divided Fed Seven members indicate no rate cuts in 2025 Eight members forecast two rate cuts in 2025 The Fed is forecasting a slower economy in 2025 and 2026 The hard data is starting to point to a slowing economy Inflation is still well above the Fed’s 2% target
By Christopher Norwood June 16, 2025
Executive Summary The S&P 500 fell 0.4% last week to finish at 5,976.97 Friday's sell-off due to Israel's attack on Iran The Volatility Index (VIX) is rising due to the war in the Middle East Higher volatility is usually associated with a down move in the market There is no chance of a Fed Funds Rate cut at this week’s meeting according to the CME FedWatch Tool The unemployment rate has been rising slowly The dollar continues to weaken The U.S. needs to reduce its spending to avoid a currency crisis  The Stock Market
By Christopher Norwood June 9, 2025
Executive Summary The S&P 500 rose 1.5% last week to finish at 6,000.36 The May payroll number came in above estimates The U.S. economy is slowing, despite the S&P 500 poking above 6,000 The Labor Force Participation Rate fell to 62.4% from 62.6% Inflation may have bottomed and is set to rise The services price paid index is pointing towards a higher CPI The declining dollar is a concern Tariffs are a tax The Q2 nowcast seems to be indicating that negative economic impacts from tariffs won’t affect Q2 International markets have far outperformed U.S. markets so far in 2025 The Stock Market The S&P 500 climbed 1.5% last week and closed at 6,000.36. The Dow rose 1.3% while the Nasdaq rose 2.0%. Interest rates rose as bond prices fell. A stronger-than-expected jobs report on Friday is getting the blame for rising yields. The jobs report was also responsible for the S&P’s gap-up open on Friday (chart below).
By Christopher Norwood June 2, 2025
Executive Summary The S&P 500 rose 1.9% last week to finish at 5911.69 The S&P 500 rose 6%, the Dow rose 3.8% and the Nasdaq climbed nearly10% in May Could see another test of support around 5,800 this week Several longer-term negative divergences may be pointing to a tough summer Declining new highs during an advancing market is a negative Earnings estimates for 2025 and 2026 have been trending lower Earnings drive the stock market over the long run
By Christopher Norwood June 2, 2025
Executive Summary The S&P 500 fell 2.6% last week to close at 5,802.82. The 20-Year Treasury auction went poorly. The yield rose above 5%. The 5% threshold has twice this year resulted in the administration adjusting its stance on tariffs. (Make that three times as Trump over the weekend gives the U.K. until July 9 th .) Longer-term inflation expectations are rising. Moody’s downgraded the U.S. to Aa1 on 16 May. The credit default swaps market sees the U.S. as a Baa1/BBB+ credit, on par with Greece. The tax cut bill will add to the deficits and debt. Long-term interest rates might well continue to rise.
By Christopher Norwood May 19, 2025
Executive Summary The S&P 500 rose 5.3% last week to finish at 5,958.38 The Dow advanced 3.4% and the Nasdaq added 7.2% A falling VIX means investor confidence is increasing A 90-day pause in the trade war sent the S&P higher Earnings estimates are falling along with GDP growth forecasts Earnings and interest rates drive the stock market over the long run Investors are chasing performance Small business hiring plans and job openings haven’t improved Norwood Economics continues to look for good companies on sale The Stock Market
By Christopher Norwood May 19, 2025
Executive Summary The S&P 500 fell 0.5%, to finish at 5,659.91 The Dow fell 0.3%, and the Nasdaq dropped 0.5% The 200-day moving average is the next resistance U.S. nominal GDP growth expected to slow significantly Bank of America shifts investment focus Norwood Economics already has exposure to gold for most clients Norwood Economics is overweight international stocks The risk of both higher unemployment and higher inflation has increased The Federal Reserve declined to lower the fed funds rate last week The Stock Market
By Christopher Norwood May 5, 2025
Executive Summary The S&P 500 rose 2.9% last week to finish at 5,686.67 The Dow was up 3% last week, and the Nasdaq rose 3.4% The counter-trend rally is ongoing Investors are extremely bearish due to worries about the trade war Political prediction markets are back Exploding imports are not a sign of weakening demand The April jobs report was better than expected The Trade War continues Capital is flowing into international and emerging markets The US dollar will likely continue to weaken The Stock Market
By Christopher Norwood April 28, 2025
Executive Summary The S&P 500 rose 4.6% last week and finished at 5,525.21 Dollar weakness is an unpleasant surprise Tariffs and the dollar's safe-haven status should have pushed the dollar higher The S&P managed to retake the 20-day moving average Investors are looking for a reason to buy Some strategists are advising to sell the bounce Negative supply shocks are bad for the economy Weakness in U.S. bonds, stocks, and the dollar has investors scared Data is beginning to point to an economic slowdown The Chicago Fed National Activity Index (CFNAI) is one of the most important and overlooked economic indicators The Stock Market The S&P 500 rose 4.6% last week and finished at 5,525.21. The Dow rose 2.5% and the Nasdaq gained 6.7%. The S&P’s gains were attributed to President Trump’s statements at a Tuesday press conference. He said that Chinese tariffs would come down, and he wouldn’t fire Fed Chairman Jerome Powell. The 10-year Treasury yield ended the week at 4.25%. The two-year Treasury yield finished at 3.79%. The dollar rebounded. The dollar index (DXY) ended the week at 99.587. It hit a 3-year low of 97.921 on Monday. The DXY has lost 9.6% since mid-January. Tariffs and the dollar's safe-haven status should have pushed the dollar higher, not lower. It is believed that foreigners are repatriating their money. America needs foreign capital. Interest rates will have to go higher to entice foreign capital to our shores if safe-haven status is lost.
More Posts