“Sticky” and “Flexible” CPI
Christopher Norwood • October 18, 2021

Rising Investment Risk- check your portfolio allocations

Market Update

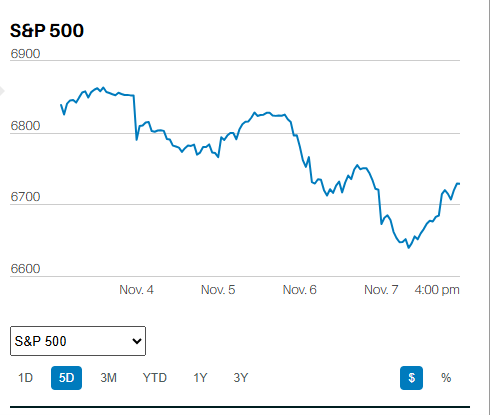
The S&P 500 rose 1.8% last week to finish at 4471.37. The index is down 1.0% since Labor Day. Markets can correct in time as well as price. The S&P did fall 5.2% from September 2nd to October 4th and hasn’t set a new high in six weeks. Now it has moved back above its 50-day moving average after spending three weeks below it. The climb above the 50-day opens the way for further upside testing. It is possible that the six-week pause will serve as a springboard to higher prices. Earnings season is here, and results will help determine the stock market’s near-term path.


The Conference Board is forecasting third-quarter GDP growth of 3.6%. The Atlanta Fed’s GDPNow forecast is calling for 1.2% growth. Yet earnings season is off to a good start despite the expected slowdown in economic growth. Barron’s Big Money Poll is out and nearly 80% of respondents expect a stock market correction in the next six months. Yet most Big Money respondents also see the bull market continuing. Only 12% of respondents are bearish. The other 88% are either bullish or neutral.


The stock market has a distinct bullish bias heading into year-end. The market is not likely to run into trouble in November and December. The one caveat is the Federal Reserve. It meets in early November. The market will react poorly if the Fed announces a more aggressive tapering timeline than expected. Otherwise, it isn’t likely we’ll see much selling into year-end. There are a few weeks left in October and earnings season to get through first, however.


Economic Update

The median expected three-year inflation rate rose to 4.2% from 4.0%, according to MarketWatch. The 5-year breakeven inflation rate is 2.71%. The 10-year breakeven inflation rate is 2.56%. The breakeven rates indicate bond investors' anticipated inflation rate. Inflation is somewhat of a self-fulfilling prophecy. Inflation is more likely to materialize if people are expecting it. A demand for higher wages to offset expected inflation is a major transmission mechanism.


The Core CPI rose 0.2% in September. The headline number was up 0.4%. Both were 0.1% higher than the prior month. The year-over-year rise in the CPI was 5.4% in September, the fastest rise since before 1990, according to Barron’s. There is a growing debate about whether the uptick in inflation is transitory or more permanent. The Atlanta Fed tracks both “Sticky” and “Flexible” CPI measures. "Sticky" CPI measures a basket of goods and services less sensitive to the economic cycle. "Flexible" CPI measures a basket of goods and services more sensitive to the economic cycle. "Flexible” CPI has risen to over 13%, reflecting a rapid increase in energy costs primarily. The “Flexible” measure hasn’t been as high since the early 1980s. The “Sticky” CPI is starting to rise as well. It is up 2.8%, which is a 13-year high. The “Sticky” measure includes housing costs, which are starting to rise. Of course, housing prices have skyrocketed in the real world. But the Federal Reserve uses Owners’ Equivalent Rent in the CPI. It tends to lag price movements in housing by a year or so.


The jury is out on transitory versus more permanent inflation. The Federal Reserve has stuck to its view that inflation will begin to subside next year on its own. It continues to signal that it doesn't expect to raise interest rates anytime soon. The next two to three quarters will tell the tale. Subsiding inflation will allow the Fed to hold off on any aggressive interest rate hikes. A continued rise in inflation will likely force its hand. A continued rise may even force the Fed to play catch up, something that always ends in tears for the stock market.


Rising Investment Risk

Bank of America is forecasting an interest rate shock in 2022. It believes the Federal Reserve will be forced to raise rates sooner and more aggressively than currently expected. According to BofA, policymakers and politicians are increasingly worried that inflation will damage growth and approval ratings. BofA thinks policymakers will pivot from pro-growth policies to anti-inflation policies. The bank points to looming U.S. monetary and fiscal cliffs as $8.4 trillion in emergency stimulus by the Federal Reserve and Treasury comes to an end. BofA points out that global tapering is already happening. Central bank liquidity measures will drop to around $100 billion in 2022 from $2.1 trillion in 2021 and $8.5 trillion in 2020.


Regardless of whether Bank of America is right in the details, it is right in the direction. Global liquidity is starting to dry up. Developed countries, particularly the U.S., are preparing to ease off the emergency measures. Reducing emergency measures is tightening. Hiking interest rates and reducing the growth in the fiscal budget is additional tightening. It is almost a guarantee at this point that both forms of tightening are looming in the next 12 to 18 months. Investing in both stocks and bonds is the riskier for it.


Investors would do well to check their portfolio allocations, making sure they are comfortable with the amount of risk they are taking. Now is not the time to be chasing returns without understanding the potential costs should markets stumble as monetary and fiscal policies shift.


Regards,


Christopher R Norwood, CFA


Chief Market Strategist 

By Christopher Norwood July 7, 2025
Executive Summary The S&P 500 rose 1.7% in a holiday-shortened week, finishing at 6,284.65 Volatility continues to fall from its elevated levels in early April The S&P is up 6.76% year-to-date. Industrials are leading the way, up 13.40% Price determines returns when buying an asset  Diversify away from a concentrated U.S. large-cap stock portfolio Job growth has been holding steady for almost a year now Analysts have been raising earnings estimates recently 90-day tariff suspension ends on Wednesday The Stock Market The S&P 500 rose 1.7% in a holiday-shortened week. The Nasdaq rose 1.6%. Both indexes set new record highs with the S&P reaching 6,284.65 on Thursday afternoon. The jobs report out Thursday spurred the S&P higher. The index gapped up at the open, closing Thursday up 0.83% (see chart below). The S&P 500 is up 26% from the selloff low on April 8, while the Nasdaq has surged 34.9%.
By Christopher Norwood June 30, 2025
Executive Summary The S&P 500 rose 3.4% last week, climbing to 6,173.07 The Magnificent 7 are outperforming the S&P 493 by over 18% since April The Cboe Volatility Index (VIX) fell as low as 16.11 last week Investors seem unconcerned about tariffs and war Treasury interest rates are starting to fall The Fed has little reason to cut if unemployment isn't moving higher The stock market is at record highs Corporate bond spreads are tight, meaning credit is abundant The dollar has fallen by around 10% in 2025 Inflation is expected to move higher because of tariff The Stock Market The S&P 500 rose 3.4% last week. The Israeli-Iranian ceasefire was credited with the surge to the upside. The index had lost 0.7% over the prior two weeks.
By Christopher Norwood June 23, 2025
Executive Summary The S&P 500 gained 0.3% last week, climbing to 5,967.84 The index is having trouble staying above 6,000 Technical indicators are turning somewhat negative The Federal Reserve kept the overnight rate at 4.25% - 4.50% The updated “dot plot” shows a divided Fed Seven members indicate no rate cuts in 2025 Eight members forecast two rate cuts in 2025 The Fed is forecasting a slower economy in 2025 and 2026 The hard data is starting to point to a slowing economy Inflation is still well above the Fed’s 2% target
By Christopher Norwood June 16, 2025
Executive Summary The S&P 500 fell 0.4% last week to finish at 5,976.97 Friday's sell-off due to Israel's attack on Iran The Volatility Index (VIX) is rising due to the war in the Middle East Higher volatility is usually associated with a down move in the market There is no chance of a Fed Funds Rate cut at this week’s meeting according to the CME FedWatch Tool The unemployment rate has been rising slowly The dollar continues to weaken The U.S. needs to reduce its spending to avoid a currency crisis  The Stock Market
By Christopher Norwood June 9, 2025
Executive Summary The S&P 500 rose 1.5% last week to finish at 6,000.36 The May payroll number came in above estimates The U.S. economy is slowing, despite the S&P 500 poking above 6,000 The Labor Force Participation Rate fell to 62.4% from 62.6% Inflation may have bottomed and is set to rise The services price paid index is pointing towards a higher CPI The declining dollar is a concern Tariffs are a tax The Q2 nowcast seems to be indicating that negative economic impacts from tariffs won’t affect Q2 International markets have far outperformed U.S. markets so far in 2025 The Stock Market The S&P 500 climbed 1.5% last week and closed at 6,000.36. The Dow rose 1.3% while the Nasdaq rose 2.0%. Interest rates rose as bond prices fell. A stronger-than-expected jobs report on Friday is getting the blame for rising yields. The jobs report was also responsible for the S&P’s gap-up open on Friday (chart below).
By Christopher Norwood June 2, 2025
Executive Summary The S&P 500 rose 1.9% last week to finish at 5911.69 The S&P 500 rose 6%, the Dow rose 3.8% and the Nasdaq climbed nearly10% in May Could see another test of support around 5,800 this week Several longer-term negative divergences may be pointing to a tough summer Declining new highs during an advancing market is a negative Earnings estimates for 2025 and 2026 have been trending lower Earnings drive the stock market over the long run
By Christopher Norwood June 2, 2025
Executive Summary The S&P 500 fell 2.6% last week to close at 5,802.82. The 20-Year Treasury auction went poorly. The yield rose above 5%. The 5% threshold has twice this year resulted in the administration adjusting its stance on tariffs. (Make that three times as Trump over the weekend gives the U.K. until July 9 th .) Longer-term inflation expectations are rising. Moody’s downgraded the U.S. to Aa1 on 16 May. The credit default swaps market sees the U.S. as a Baa1/BBB+ credit, on par with Greece. The tax cut bill will add to the deficits and debt. Long-term interest rates might well continue to rise.
By Christopher Norwood May 19, 2025
Executive Summary The S&P 500 rose 5.3% last week to finish at 5,958.38 The Dow advanced 3.4% and the Nasdaq added 7.2% A falling VIX means investor confidence is increasing A 90-day pause in the trade war sent the S&P higher Earnings estimates are falling along with GDP growth forecasts Earnings and interest rates drive the stock market over the long run Investors are chasing performance Small business hiring plans and job openings haven’t improved Norwood Economics continues to look for good companies on sale The Stock Market
By Christopher Norwood May 19, 2025
Executive Summary The S&P 500 fell 0.5%, to finish at 5,659.91 The Dow fell 0.3%, and the Nasdaq dropped 0.5% The 200-day moving average is the next resistance U.S. nominal GDP growth expected to slow significantly Bank of America shifts investment focus Norwood Economics already has exposure to gold for most clients Norwood Economics is overweight international stocks The risk of both higher unemployment and higher inflation has increased The Federal Reserve declined to lower the fed funds rate last week The Stock Market
By Christopher Norwood May 5, 2025
Executive Summary The S&P 500 rose 2.9% last week to finish at 5,686.67 The Dow was up 3% last week, and the Nasdaq rose 3.4% The counter-trend rally is ongoing Investors are extremely bearish due to worries about the trade war Political prediction markets are back Exploding imports are not a sign of weakening demand The April jobs report was better than expected The Trade War continues Capital is flowing into international and emerging markets The US dollar will likely continue to weaken The Stock Market
More Posts