

S&P surpasses 5,000
Commercial Real Estate (CRE) loans could trigger a stock market sell-off in 2024
Market Update
The S&P rose 1.4% last week closing at 5,026.61. It didn’t take long after all to surpass the big round number. The S&P has closed higher 14 of the last 15 weeks. It hasn’t done that since 1972. The volatility index is 12.9, below its 20-year average of 17.7. Low volatility signals investor complacency. Ten Mega Cap stocks now represent 35% of the S&P 500. They are also mostly responsible for the stock market advance since October. There is some reason for that. The Magnificent Seven stocks have had earnings revised up by 4% as a group for Q4 2023. The S&P overall has had earnings estimates cut by 11% for Q4. The S&P 493 has seen earnings estimates cut by 15% for Q4 2023.

A handful of mega-caps can only power the market higher for so long. Their average P/E is over 50x. Microsoft is the world’s most valuable company. Its market cap is $3.1 trillion, nearly twice the market cap of the S&P energy sector. Meanwhile, Microsoft’s free cash flow is only half that of the energy sector’s free cash flow. The U.S. tech sector is worth one-third of the total U.S. equity market. That tops the previous peak in 2000 at the height of the dot-com bubble. The Nifty Fifty were no-brainer buys in the 1960s until they weren’t. History might not repeat but it often rhymes (Mark Twain is credited with saying).
Momentum is an investor’s friend right now. But momentum fades. And the market is expensive trading at 20.4x 12-month forward earnings. Interest rates rose last week. The two-year Treasury finished at 4.51%. The two-year leads the Fed funds rate. The futures market is no longer expecting a March cut. A May cut is fifty/fifty. The 10-year Treasury ended the week at 4.19%, the 20-year Treasury rose to 4.51% and the 30-year to 4.39%.
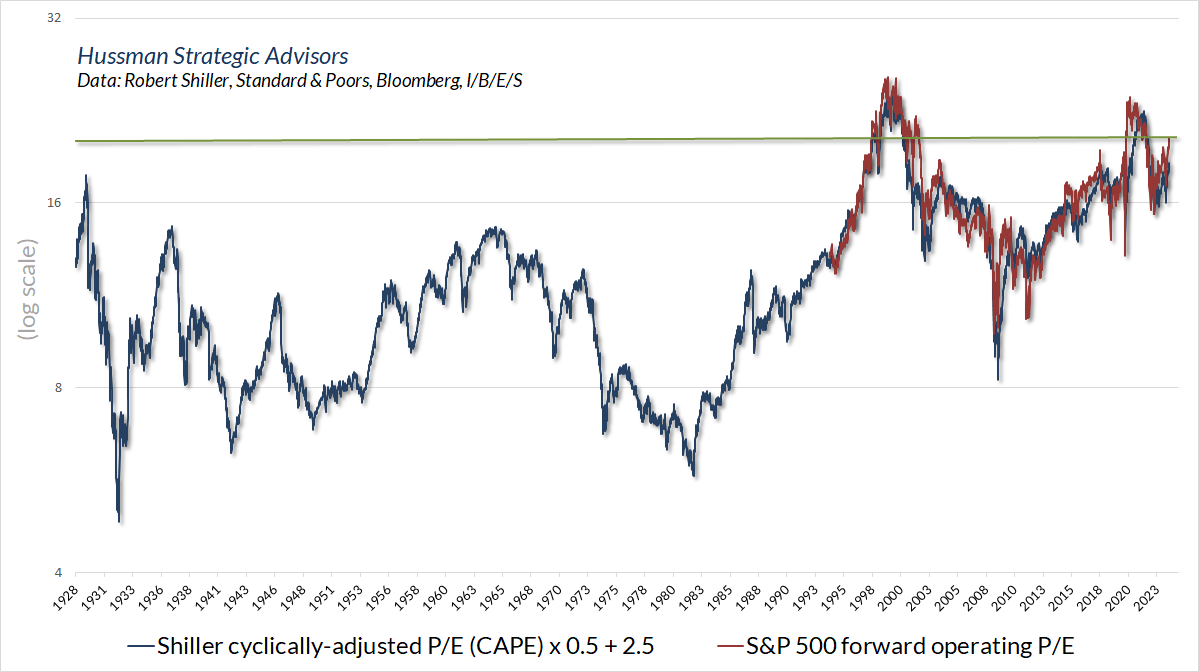
The S&P is more expensive then at any time except 2000 & 2020
An expensive market can stay expensive for years. Below-average returns though are almost guaranteed when buying an expensive market. Investors buying the market in 1929 lagged Treasury bill returns from 1929 until 1947. Buying at the 1966 top meant lagging Treasury bills until 1985. Most recently the S&P 500 trailed Treasury bills from 2000 until 2013. Valuations are at levels that lead to minimal returns over the following decade. In fact, S&P returns remain below Treasury bills since January of 2022, a more than two-year period. A long period of stock market underperformance may already have started.

Expensive markets lead to low returns, cheap markets lead to high returns. The current market indicates negative returns over the next 10-12 years
(see arrow 2/2/24 in lower right of chart)
We’ll see if the market can stay above the big round number. It is overbought and, it bears repeating, expensive. Likely a catalyst is needed to switch off the risk on trade. There are several potential catalysts lurking. An expansion of the wars in Europe or the Middle East. Rising long-term interest rates and a strengthening dollar. A Fed reluctant to ease with the economy strong and the stock market setting records. Falling earnings estimates. Finally, a recession isn’t out of the question later this year. That is no longer the consensus for 2024 though. Take your pick of potential catalysts. It’s anyone’s guess. We won’t know what will set off the next market pullback until it does.
That said, commercial real estate is a top candidate. Trouble for the economy and stock market often starts in the financial system. The Great Recession was all about banks lending recklessly into a housing bubble. This time it is commercial real estate (CRE) that is showing signs of unraveling.
We mentioned New York Community Bank (NYCB) last week. The stock is down 50% since the $100 billion regional bank reported a loss of $252 million for Q4. The bank was forced to raise its loan loss provisions by around $490 million. According to the bank, “the increase is primarily attributable to higher net charge-offs.” NYCB has low exposure to CRE loans, which account for 12% of its total lending. U.S. banks with higher exposure to CRE lending will likely face worse losses soon.
Fed Chair Ben Bernanke famously claimed in March 2007 that the growing subprime loan problems were contained. It was in the early stage of what became a financial crisis that almost broke the banking system. The same claim is being made now about NYCB’s problems. It is unlikely that NYCB is the only bank experiencing rising loan losses. In fact, there are already other banks reporting earnings hits due to CRE loan exposure. Aozora, a Japanese bank with significant US commercial real estate exposure is one. Swiss bank Julius Baer is another. Falling CRE prices and higher rates mean more banks will report troubled loans in the coming quarters.
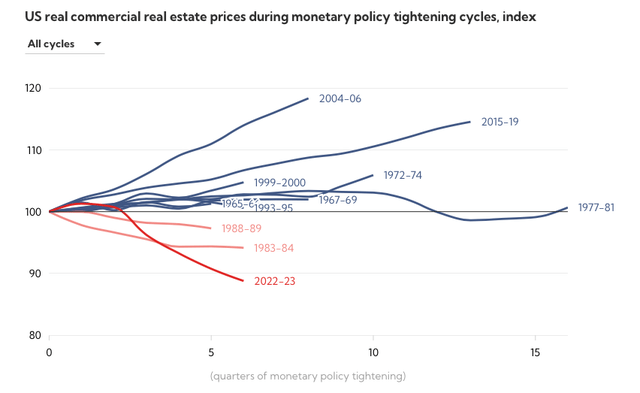
The chart shows that the current price decline is the steepest in at least half a century.
It's estimated that the national office vacancy rate is at a record of almost 20 percent. Commercial property prices have already fallen by around 20 percent. Morgan Stanley expects commercial property prices to decline by 40 percent from pre-Covid levels. A wave of commercial property loan defaults is coming. Many developers won't be able to roll over commercial property loans at higher interest rates. Approximately $1.2 trillion in loans are coming due in 2024, according to Goldman Sachs. It's estimated that almost 70% of all CRE loans are held by small banks. Barry Sternlicht is pessimistic. He is the CEO of Starwood Capital Group, a real estate investment firm with $115 billion under management. “The office market has an existential crisis right now,” he said recently. “It’s a $3 trillion asset class that is probably worth $1.8 trillion. There’s $1.2 trillion of losses spread somewhere and nobody knows exactly where it all is.”
The National Bureau of Economic Research (NBER) is sounding the alarm. A recent study done by NBER estimates that a wave of commercial property loan defaults is coming. It could result in the failure of up to 385 regional banks. The Federal Reserve recently removed the phrase, “the U.S. banking system is sound and resilient” from its policy statement. Chairman Jerome Powell said a few weeks ago that commercial real estate “feels like a problem we’ll be working on for years. It’s a sizable problem.” And let’s not forget that the banking system is sitting on some $600 billion in bond losses already.
Economic problems often start with financial system problems. No one can know for sure what the catalyst will be that triggers the next sharp decline in the stock market. A credit crunch due to bad commercial real estate loans is a candidate. Expect more banks to report losses due to big increases in loan loss provisions. A Fed forced to ride to the rescue of the banking system later this year is a real possibility. Such a scenario would almost certainly cause stock investors to switch off the risk on trade.
Economic Indicators
It was a light week for economic reports. Initial jobless claims remained low at 218,000. Consumer credit growth dropped from 23.4B in November to $1.5 billion in December. Perhaps an early sign that consumers are hitting a wall now that the excess Covid savings are spent. The ISM services index was strong, rising to a four-month high of 53.4% in January. The index hit a seven-month low in December.
The next big data point is the CPI reading which will be released on Tuesday. It’s expected to rise 0.3%. The Fed uses the PCE for monetary policy, but the CPI is still of interest. The two measures of inflation tend to move together. Many of the underlying price indices that make up the PCE come from the CPI. The sticky price consumer price index has been trending sideways since March of 2023. But the sticky price consumer price index less food and energy is still falling. Inflation seems under control. A good reading Tuesday is likely to propel the S&P higher despite its overbought condition.
Constructing Portfolios
We wrote about diversification and correlation last week. My brother was looking at the correlation between the Russell 2000 and the S&P 500. It is high at around 0.9. (1.0 is perfectly correlated). The reason for the high correlation is that they are both U.S. stock indexes. Stocks are a single asset class. You won’t get much diversification by investing in different parts of the stock market. To diversify one needs to invest in other asset classes besides stocks.
I let my brother know that Treasury bonds and gold are much more effective at reducing risk in a portfolio. But that you do give up return in exchange. Creating the highest risk-adjusted return is the goal. Think of it as portfolio efficiency. The problem to solve is how to generate the most return with the least possible risk.
Billionaire hedge fund manager and Bridgewater Associates founder Ray Dalio is big on diversification. Dalio’s All-Weather portfolio has reportedly done quite well over the last 30 years. The goal of the All-Weather portfolio is high risk-adjusted returns regardless of the environment. That's achieved by using asset classes with a low correlation to one another. The asset classes in the All-Weather portfolio react differently to inflation, deflation, economic growth, and recession. Dalio’s portfolio is reportedly 30% stocks, 40% Long-term Treasuries, 15% Intermediate-term Treasuries, 7.5% gold, and 7.5% commodities. The All-Weather portfolio since 1996 has earned 8.4% per year with an 11% standard deviation and a 0.43 Sharpe ratio (return to risk). Of course, a big part of that return came from bonds which have been in a bull market for much of the last 40 years. Bonds are unlikely to provide the same high returns over the next decade or so. Bond returns have been negative over the last three years.
Correlations between the different asset classes are low, except for the two Treasury bond investments. The 10-year correlation between commodities and long-term Treasuries is -0.35. It is -0.29 between intermediate-term Treasuries and commodities. Commodities and Gold have a 10-year correlation of 0.12. The 10-year correlation between U.S. stocks and: commodities is 0.42; Gold 0.11; long-term Treasuries 0.09; and intermediate-term Treasuries 0.08.
Investors that want to diversify away asset class risk must use Treasury bonds, gold, and commodities. Owning only subclasses of the single asset class that is stocks isn't enough. Investors must also accept lower absolute returns if they wish to earn higher risk-adjusted returns. Finally, a word of caution. The Dalio All-Weather portfolio might not perform as well in the future as it has in the past. Nevertheless, the principle of diversification will continue to work well for investors seeking high-risk adjusted returns.
Regards,
Christopher R Norwood, CFA
Chief Market Strategist


