

Executive Summary
- The S&P declined 1% last week after a 6-week rally
- Bullish strategists are raising their year-end target for the S&P 500
- The Fed is forecasting 2% GDP growth in 2025 and 2026
- The Neutral Fed Funds rate may be around 3.5%
- A High-Priced Market Means Below Average Returns over Long Periods
- Diversification aids in reducing risk and improving returns
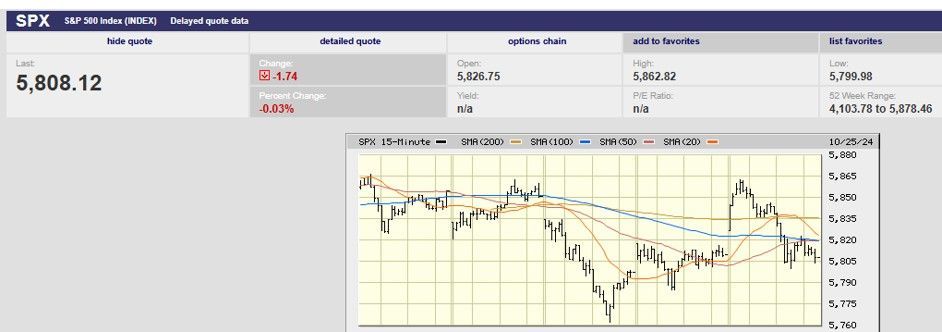
5-day S&P 500 chart
Market/Economic Update
The S&P 500 ended the week at 5,808.12 down 1%. The Dow and the S&P fell last week after six positive weeks in a row. In fact, the Dow fell five days in a row last week. Meanwhile, the Nasdaq gained for the seventh week in a row, its longest winning streak of the year. It also touched a record high intra-day of 18,518.6. The high came early in the day on Friday though and was met with selling. The S&P 500 also saw an early high on Friday that was met by selling. It’s likely the Nasdaq will join the S&P 500 and Dow to the downside next week. The drop in the S&P 500 this week is a normal part of an uptrend. Markets don’t move in straight lines.
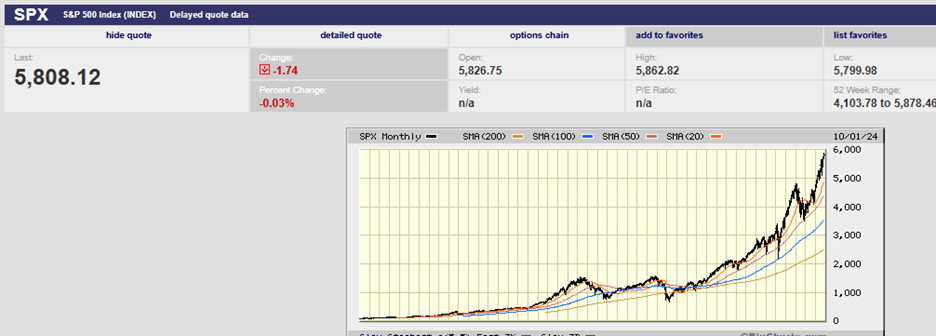
S&P 500 Long Term Chart
The longer-term trend is still up. The parabolic move isn’t sustainable though (see the chart above).
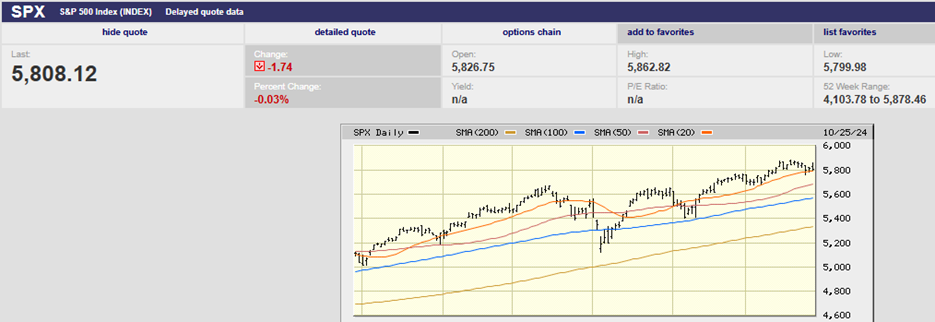
S&P 6-Month Chart
The S&P is currently supported by the rising 20-day moving average (see chart above). The index penetrated but closed above the 20-day on Wednesday. It bounced off the 20-day on Thursday. It bounced off the 20-day again on Friday. We may experience a pullback to the 50-day around 5,690 leading into the election. Economic and market strength make a bigger pullback before year-end unlikely.
Bullish strategists are raising their year-end target for the S&P 500. HSBC raised its target to 5,900 last week. Goldman Sachs raised its year-end target to 6,000 a few weeks ago. Goldman's 12-month forecast is 6,300. Strategists are pointing to above-trend GDP growth, easing inflation, and lower interest rates as contributing factors. Easing inflation and lower interest rates go together. Above trend GDP growth is the outlier. Normally the Fed is easing because the economy is struggling. Not this time. Above trend growth usually means rising inflation and interest rates. After all, that’s what above trend means (insufficient slack in the economy to prevent a rise in prices). And it's why growth needs to slow at least to trend if rising inflation is to be avoided. The soft-landing scenario that is now consensus requires the economy to slow.
The Five-Year Breakeven Inflation Rate is rising.
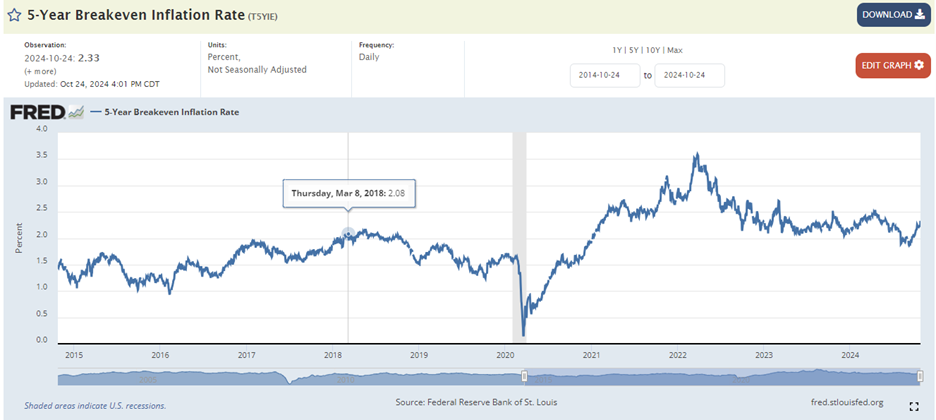
The Fed believes that the sustainable non-inflationary GDP growth rate is 1.8%. Currently, GDP is running around 3%. The Atlanta Fed GDPNow forecast is for 3.3% growth in Q3 of 2024. The Fed is forecasting 2% GDP growth in 2025 and 2026. There is scant sign of slowing in the economy though. And that makes possible another scenario. A scenario in which inflation and interest rates rise rather than the economy slowing. In fact, interest rates are rising now. Rising rates are signaling that a no-landing scenario is increasingly likely. Might they also be signaling higher inflation sometime starting in 2025?
The 10-Year Breakeven Rate is rising.
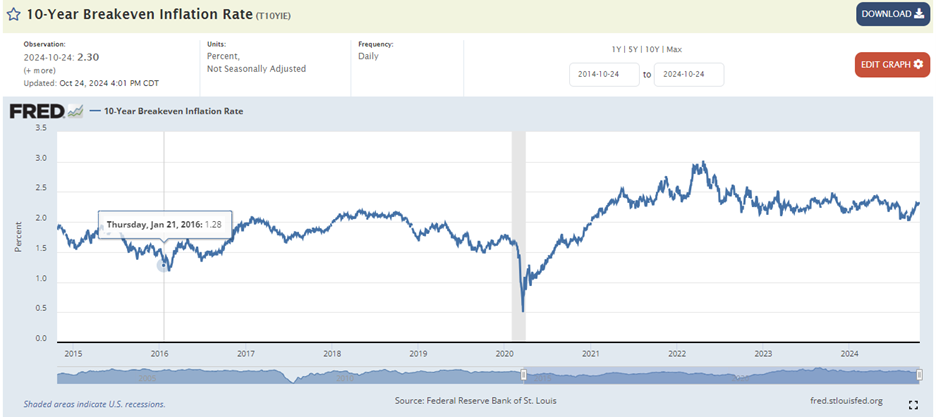
The two-year Treasury yield rose to 4.12% last week. The 10-year Treasury yield rose to 4.25% from 4.19%. The 10-year Treasury yield is up some 0.57% since the Fed rate cut. Few strategists were expecting the 10-year yield to rise following the Fed cut. Instead, the forecast was for interest rates to fall along the entire yield curve. The economy has been stronger than expected since the September rate cut. Inflation has been higher than expected since the cut as well. The bond market may also be discounting a Trump victory. Tax cuts and tariffs will put upward pressure on prices all else equal.
We haven’t had a major inflationary episode in decades. Inflation falling from a high level gives the Fed the room it needs to lower the Fed funds rate. That's the belief among economists at any rate. The so-called neutral rate is the rate that neither stimulates nor restricts the economy. It is a theoretical number, not observable. It is a theoretical number that the Fed appears to be targeting (data dependency be damned). The problem is that Fed officials don’t appear to agree on where R star resides. The range between Federal Reserve Open Market Committee members runs from 2.4% to 3.8%. The funds rate is currently 4.75% to 5.00%.
It's likely that the Fed has started cutting because of the gap between the Fed funds rate and the theoretical R Star rate. The recent economic data certainly hasn't shown the need for interest rate cuts, let alone a half point cut. The FOMC seems to believe that the R Star rate is well below the current funds rate. Exactly how far below is open to debate. The Fed isn’t alone in its uncertainty about the R Star rate either. Ten different estimates of the real neutral rate recently compiled by Deutsche Bank economists range from 0.7% to 2.5%. The average estimated real neutral rate is 1.5%. Add 2% for inflation and that places the average nominal R Star estimate at 3.5%.
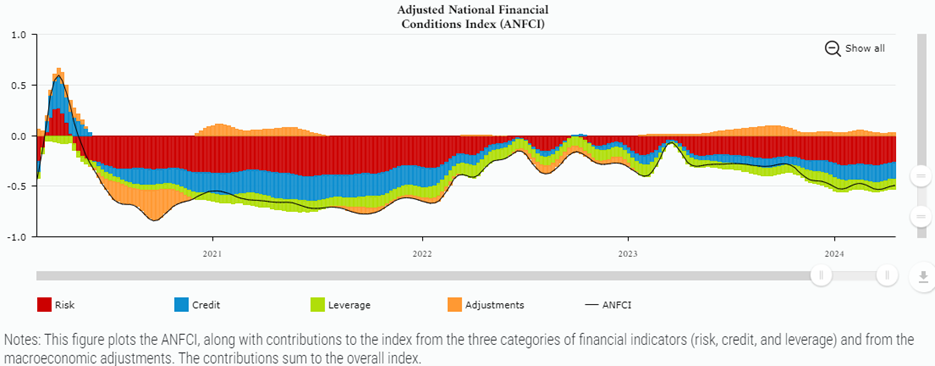
In the Fed's world then, monetary policy will be restrictive until it lowers the funds rate to at least 3.5% or so. But what if monetary policy isn't as restrictive as the Fed believes? We’ve written repeatedly over the last few months that financial conditions are loose. The Fed’s own financial conditions index shows that financial conditions are not tight. The Goldman Sachs and Bloomberg models show loose financial conditions as well. A no landing scenario means higher interest rates than currently expected. And that potentially means trouble for both the bond and stock markets in the coming months.
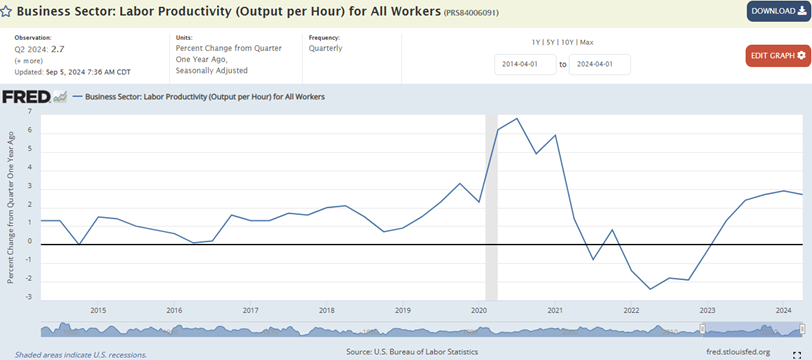
Fed rate cuts and above trend GDP growth mean inflation might not continue to fall. Too much demand chasing too little supply means rising not falling prices. Real economic growth is the sum of labor force growth and productivity increases. Labor force growth is expected to grow at a rate of 0.4% annually from 2023 to 2033. Productivity growth is 2.7% as of September 2024. It peaked at 2.9% in Q1 of 2024. The Fed is estimating productivity growth of 1.4% given labor force growth of 0.4% and its estimated trend GDP growth rate of 1.8%. Long run productivity growth has been around 2.2%. Productivity growth has been closer to 1.5% over the last two decades. In theory then any GDP growth rate above about 2% should be inflationary.
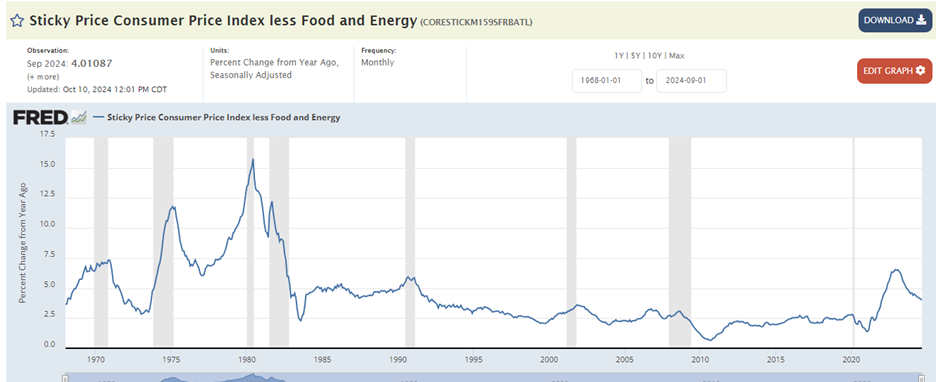
GDP growth above trend, inflation above target, the Fed cutting rates, not a recipe for bringing inflation down to 2%. The sticky Consumer Price Index (CPI) less Food and Energy is showing inflation growth of 4.01% as of 10 October. The Sticky Price Consumer Price Index (CPI) is calculated from a subset of goods and services that change price infrequently. Economists believe that sticky CPI gives a more accurate estimate of future inflation. Also, core CPI was 3.3% year-over-year in September rising from 3.2% the prior month. Core CPI isn't close to the Fed's 2.0% target yet and is moving in the wrong direction.
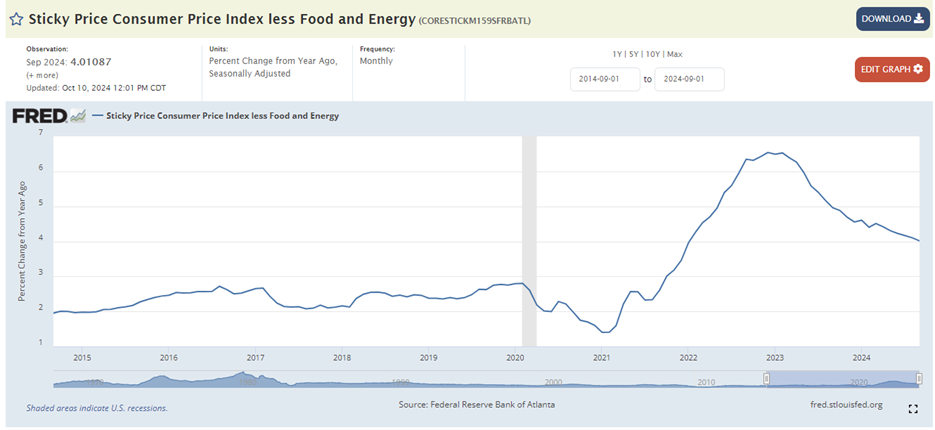
A longer term look at Sticky CPI (chart below)
There are reasons to believe that the inflation rate will stop falling before it hits 2.0%. Those reasons may cause the inflation rate to rise again in 2025/26. “We're really concerned about the potential for much larger tax cuts under a red sweep,” George Goncalves, head of U.S. macro strategy at MUFG, told Bloomberg TV on Thursday. Tax cuts will give consumers more capacity to spend. The temporary increase in spending will put upward pressure on prices. Also, the nonpartisan Committee for a Responsible Federal Budget recently highlighted the continued deficit spending planned under either Presidential candidates. The Committee's recent report estimated that former President Donald Trump’s economic plans would increase U.S. debt by $7.5T through 2035. Spending plans by Vice President Kamala Harris would increase debt by around $3.5T.
So, deficit spending is set to continue regardless of who wins the election. Government deficit spending adds to demand, increasing the likelihood of rising prices. The Biden administration just finished fiscal 2024 (ended on Sept. 30) with a shortfall of $1.8 trillion. That's equal to about 6.5% of gross domestic product. It's a tide of red ink unheard of except in recessions or times of war. It's also a big reason why the U.S. has avoided recession so far.
“The wealth effect, stemming from a 41% rise in the S&P 500 index since its 52-week low almost exactly a year ago on Oct. 27, 2023, and the appreciation of home prices, along with fiscal stimulus from the Washington, D.C., deficits, are why the U.S. economy has defied persistent forecasts of a recession,” said Doug Ramsey, chief investment officer of the Leuthold Group, on a webinar for clients on Thursday.
And then there are tariffs, which also mean higher prices. Tariffs will also slow the economy. Stagflation becomes a possibility if both candidates impose additional tariffs.
The stock market will likely continue to rise at least into the year-end. Interest rates will fall at the short end if the Fed continues to cut the funds rate. The long end is another matter. It is possible that intermediate and long-term rates will not fall. Its possible longer-term rates will continue to rise instead. Heavy government spending, tax cuts if they materialize, and more tariffs increase the odds of inflation rising once again in 2025/26. Rising inflation means contracting price-to-earnings ratios for stocks.
Everything may work out fine for stock and bond investors over the next year or two. But there is a rising risk of inflation rebounding if the economy continues to grow above trend. A no landing scenario is increasingly likely given rate cuts and big deficit spending.
Uncertainty is higher than normal and risk management a priority.
A High-Priced Market Means Below Average Returns over Long Periods
Price determines long run returns. Stock prices are high.

Stock prices are high because returns since 2009 have been well above normal. Note the real return (net of inflation) from 1928 to 2023 compared to returns since 2009 (chart below).

High prices lead to low returns over long periods of time.
“The investment landscape today looks eerily similar to 1999,” wrote Ben Inker, co-head of asset allocation at GMO in a recent report. GMO is an asset manager with over $60 billion under management. 1999 was the peak of the dot-com stock bubble. GMO calculated at the time that a 60/40 stock/bond portfolio was priced to return only 2% annually after inflation over the following decade. A 60/40 stock/bond portfolio had returned 8% per year the prior decade. The 2000/2002 bear market started a few months after GMO published its return estimates. The S&P 500 had zero return from the spring of 2000 until the summer of 2013.
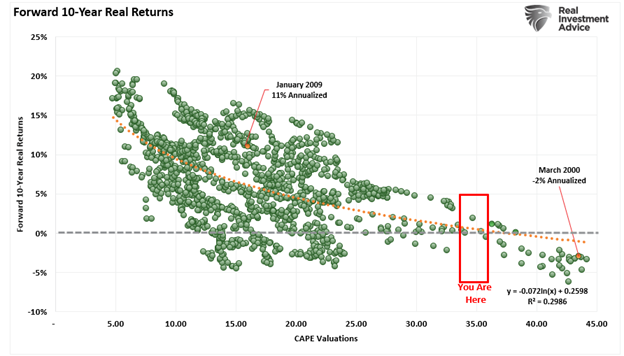
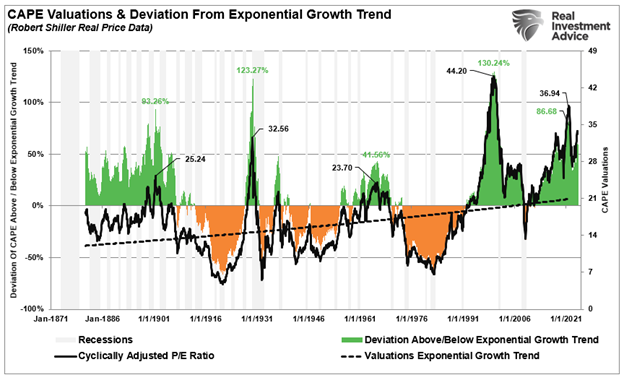
Today, David Kostin, chief U.S. equity strategist at Goldman Sachs predicts an S&P 500 return of 1% a year after inflation over the next decade. Kostin bases his estimate in part on the Cyclically Adjusted P/E ratio (CAPE). Today’s CAPE is higher than it was just before the crash of 1929, and only slightly lower than before the 2000 crash.
J.P. Morgan is expecting below normal returns for the next decade as well. The investment bank isn’t as pessimistic as Goldman Sachs though. A recent Morningstar article relayed J.P. Morgan’s view. “The investment bank’s models show the average calendar-year return for the S&P 500 could shrink to 5.7%*, roughly half the level since World War II. Millennials and Generation Z might not enjoy the robust returns from U.S. stocks that helped swell the retirement accounts of their parents and grandparents.”
*The J.P Morgan estimate is a nominal return. Subtracting 2% for inflation gives a real return estimate of 3.7%.
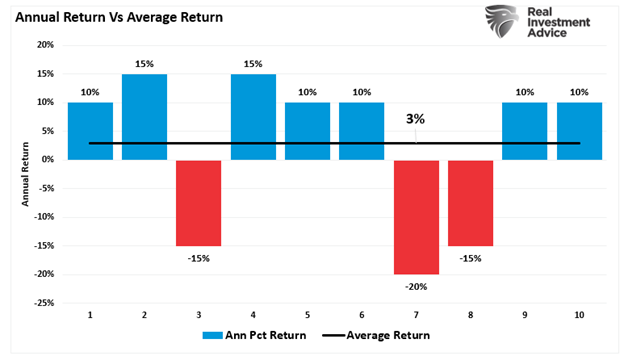
It’s important to keep in mind that average returns don’t necessarily mean poor returns year in and year out. The chart below shows a 10-year average return of 3%. Still, there are plenty of good investment years in this example. Minimizing losses in down years would increase the 10-year return.
I listen to Bloomberg radio on the commute to and from work. Last week it seemed as if market strategists were reading from the same research notes. They described how their firms were underweighting large U.S. stocks. Money coming out of large U.S. stocks was being allocated to bonds, U.S. small-cap stocks, and international and emerging market stocks. To a man and woman, they urged investors to diversify. They pointed out repeatedly the importance of diversification in reducing risk and improving returns.
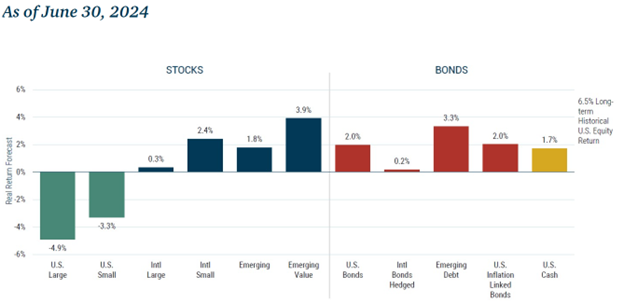
GMO's founder Jeremy Grantham is known for his work on asset bubbles. GMO is also known for its asset allocation expertise. One of its tools is its seven-year forecast. The asset manager relies on math and mean reversion to point the way. One of GMO’s portfolio strategies’ is called a Benchmark-Free Allocation. It is a go anywhere, invest in any asset portfolio. It currently calls for a heavy weighting in overseas stocks. “The U.S. is trading at or near its largest premium ever relative to the rest of the world,” writes Inker. Looking at the seven-year real return forecasts in the chart below shows you why GMO has a heavy overweight in International stocks.
Diversification and a focus on low-priced stocks will reduce risk and improve returns. Those benefits of diversification may prove particularly helpful to U.S investors in the coming decade.
Regards,
Christopher R Norwood, CFA
Chief Market Strategist


