Investment Accounts vs. Investments

Market Update
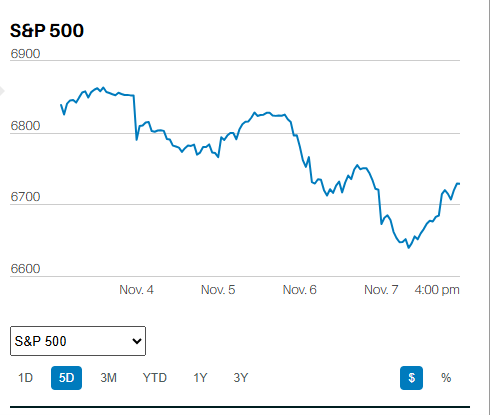
The S&P 500 fell 2.9% last week. The Dow also dropped 2.9% while the Nasdaq fell 2.7%. The S&P closed at 3585.62. It has dropped 15% in six weeks and is down 24% on the year. It has been the worst first nine months of the year in twenty years. Meanwhile, the Federal Reserve has all but promised another 1.25% in rate hikes by the end of the year. It has also begun shrinking its balance sheet by $95 billion monthly. Earnings estimates are declining but are likely still too high. There is a growing consensus that a recession is coming in 2023 if not before. Investors are expecting the stock market to continue to fall as a result. How much and for how long seem to be the only questions.
It is possible but not a given that we’ll see a further decline in the S&P 500, perhaps to 3,000. It would mean a further decline of 16%. The bear market began after the S&P rose to 4818.62 on 4 January. A fall to 3,000 would be a total decline of 37.7%. The index is already off 25.6% from its all-time high. The consensus for 2022 S&P earnings is $223.83. The S&P is trading at about 16x 2022 earnings estimates, which is about the long-run average. The consensus for 2023 earnings is $242.22. The S&P is trading at about 14.8x 2023 earnings estimates.
S&P 500 earnings estimates are going to drop, perhaps all the way to $200 per S&P share. A decline to 3,000 would keep the S&P trading at 15x earnings. All of which means 3,000 is a reasonable downside target if the U.S. does have a recession in 2023. Our clients might disagree, but a 38% decline in the S&P 500 is hardly the end of the world. Nor are we guaranteed to get it. The U.S. economy is structurally strong. It is resilient. A shallow recession may already be priced into the stock market. Stock markets are leading indicators. They often are six to nine months ahead of fundamentals.
A bottoming process at 3,500 and a recovery into year-end is another realistic possibility. Predicting short-term stock market movements is hard. Market strategists aren’t very good at it.
Of course, the bear market might drive the S&P 500 below 3,000. The Federal Reserve has a history of overdoing it with both easing and tightening. One increasingly likely scenario involves the Federal Reserve breaking something. Its aggressive rate hikes along with the shrinking of its balance sheet are increasing the odds.
The collapse of the British pound and the Bank of England’s intervention in its bond market might be the start of just such a crisis. The BofE last week purchased 65 billion pounds of British government bonds to stop a collapse in bond prices. British pension plans apparently were hemorrhaging losses as they found themselves on the wrong side of the bond market. The BofE bailed them out with its purchases. The collapse in British bond prices was in part tied to the fall of the British pound against the dollar. The dollar is at 20-year highs to a basket of major currencies. The Fed's rapid tightening of monetary policy is partly responsible.
We live in an interconnected world. An overseas crisis that the U.S. has contributed to can come back to our shores. Breaking something will likely force the Federal Reserve to pivot. The Fed ends a tightening cycle and begins an easing cycle after something blows up. Think dot.com bubble and housing bubble. The breaking-something scenario is becoming more likely. The breaking-something scenario also would mean a quicker end to the bear market. The drop to 3,000 or below would happen faster. The market would turn and rally as soon as the Fed announced it was riding to the rescue. Mind you it would be rescuing investors from a crisis of its own making. It might also be rescuing investors from a lower price level as well. Still, a bottom would materialize and a new bull market begins.
Norwood Economics will continue to look for and buy good companies on sale. Part of our investment process is requiring stocks to base for at least a few months. Most stocks we follow are trending lower. We will need to see some signs of individual stock prices stabilizing before we buy them. But we will buy them once that has happened regardless of our views on the stock market. Market timing doesn’t work. Reacting to short-term results is almost always a bad idea. Remember that the value of a business doesn’t change just because the price of its stock does.
Economic Indicators
The Chicago Fed national activity index for August was 0.0. A reading above zero indicates an economy growing above trend. A reading below zero indicates an economy growing below trend. The CFNAI is made up of 85 separate economic indicators. The Case Shiller U.S. home price index fell 2.9% in July. The FHFA U.S. home price index fell 6.9% in July. Rapidly rising home prices are a thing of the past. The housing industry impacts about 15% of the economy. Falling home prices haven’t hurt new home sales yet. New home sales for August were 685,000 up from 532,000.
Consumer confidence is rising as well. The consumer confidence index for September rose to 108.0 from 103.6 the prior month. Initial jobless claims fell to 193,000 last week from 209,000 the prior week. The low level of jobless claims indicates that the labor market is still strong. Real Gross Domestic Income (GDI) growth was revised to 0.1% in Q22022 from 1.4%, still a positive number. Real final sales growth in Q22022 was revised to 0.2% from a negative 0.2%. Real consumer spending and disposable income both rose 0.1% in August.
Overall, economic data was consistent with a slowly growing economy. A recession in 2023 is likely but we don’t seem to be there yet.
Roth IRAs are not investments
Roth IRAs are a type of investment account but are not themselves investments. I spoke with a 401(k) participant last week who “wanted to move his money from his Roth IRA to something that didn’t lose money.” We had a nice conversation and eventually sorted things out. Turns out he didn’t even have a Roth IRA.
Instead, he had a 401(k) account with a prior employer. His account was in a Fidelity 2045 target date fund. He’d been making after-tax contributions into the Roth option in his old 401(k). The Fidelity 2045 is down 25.8% on the year. The portfolio has 89% in stocks and 8% in bonds. The stock exposure includes 47% U.S. and 42% non-U.S.
IRAs, Roth IRAs, brokerage accounts, and 401(k) accounts are types of…. accounts. They are not investments. Stocks are investments. Bonds are investments. Real estate is an investment. Commodities are investments. Mutual funds are investments but only indirectly. “I own a mutual fund” doesn’t tell us anything. What does the mutual fund own? It’s what the mutual fund owns that matters. There are stock mutual funds, bond mutual funds, real estate mutual funds, and even commodity mutual funds.
The 401(k) participant is invested in the Vanguard 2045 target date fund with his current 401(k) plan. It has lost 24.1% on the year. The portfolio has 84% in stocks and 13% in bonds. The stock exposure includes 51% in U.S. stocks and 33% in non-U.S. stocks. International stocks have underperformed U.S. stocks in 2022. Index funds are outperforming active funds as usual. Those factors likely explain the slight difference in returns between the two funds.
The 401(k) participant decided to move his Fidelity 401(k) account. He's going to consolidate it with his current 401(k) plan. He also decided to keep the 2045 target date fund rather than react to short-term results. Going to cash is very costly. You may limit your immediate losses but will almost certainly limit your long-term returns. A decade from now he will be happy he maintained his strategic allocation.
Regards,
Christopher R Norwood, CFA
Chief Market Strategist


