Stocks may struggle in the first half of 2023

Market Update
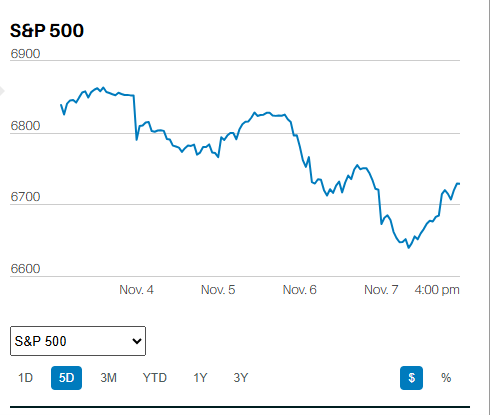
The S&P 500 fell 0.1% last week to finish the year at 3839.5. It lost 19.4% on the year. The Nasdaq was down 0.3% last week. It lost 33.1% for the year. The Dow was down 8.8% on the year. All three indexes turned in their worst performances since 2008. The Nasdaq’s underperformance shouldn't have come as a surprise to anyone. Growth stocks were expensive at the start of 2022. They are still expensive.
“Investors will benefit from diversifying away from US large cap growth stocks in the coming years,” we wrote last December (Vol. 155). As it turned out, large-cap growth stocks were some of the worst performers in 2022.
“Treasury bonds are considered safe investments. They are not safe now, given the likelihood of rising rates over the next 10 years,” we also wrote last December (Vol. 153). Bonds had their worst year in decades in 2022. The iShares Core U.S. Aggregate Bond ETF (AGG) lost 13.02% in 2022. The iShares 20+ Year Treasury Bond ETF lost 31.24% (after losing 4.60% in 2021). Bonds will probably have a better year in 2023. They are still likely to struggle in the coming decade though. Bonds don't do well when inflation is rising. Inflation is falling now but will be higher over the next 10 years than the last 10 years.
We wrote in the same newsletter last year that, “Inflation is high and rising now. The hope is that it is temporary. The reality is that much of it is not. The Federal Reserve will not be able to ignore continued high inflation numbers.” The Federal Reserve didn’t ignore inflation. It began its rate hike campaign in March 2022. It has raised the Fed funds rate from 0.00% to 4.25%. It is signaling more rate hikes in 2023. The Fed is also shrinking its balance sheet, which ballooned from around $4.9 trillion to almost $9 trillion during Covid. M2 growth is negative. A falling money supply makes recession far more likely. A falling money supply is also bad news for stocks.
We also wrote last December that, “Liquidity has driven much of the bull market that started in March 2009. The S&P 500 index has risen far faster than earnings. Shiller’s P/E bottomed at 14.12 in February 2009. It is at 38.08 as of December 2021. Shiller’s P/E uses the average inflation-adjusted earnings from the last 10 years. The ratio has only been higher in the late 1990s. It peaked at 44.19 in December 1999. The next decade saw negative returns for the S&P 500 index for only the second time ever. The first time was during the Great Depression. Monetary tightening makes it more likely that stocks will fall in 2022 and/or 2023. The high price-to-earnings multiple means low returns over the next decade. Investors can still earn a respectable return by buying good companies on sale. Owning the entire market holds less promise.”
Stocks did fall in 2022. They will fall again in 2023, at least for the first half of the year. It’s possible we’ll see a recovery in the second half. That will depend to a large extent on Federal Reserve monetary policy. As well, it paid to own good companies on sale rather than the entire market. Norwood Economics' stock portfolio far outperformed the stock market.
Last December we also wrote that “Norwood Economics’ base case is for a flat market next year (2022). We think a 15% decline at some point during the year is quite likely. Rising interest rates, a slowing economy, slowing earnings growth, and Covid makes a correction highly probable. A strong jobs market and large excess consumer savings make a recession and bear market unlikely in 2022.” (Vol. 154)
We were right about a lack of recession in 2022. We weren’t pessimistic enough about the stock market, however. Fast forward to today and we do think a recession is likely in 2023. It’s probable that the stock market struggles in the first half. Earnings estimates are too high. Falling estimates will put pressure on the stock market.
Analysts are still expecting 4.7% earnings growth in 2023. Norwood Economics is forecasting a decline in earnings of around 20%. The current consensus is for $229.78 per S&P share. Earnings of $185 to $200 are more likely. The S&P 500 should bottom in the low 3,000s before starting to recover in the second half of the year. Inflation will end in 2023 between 3% and 4%. Bonds should have a positive year. The stock market will break even. Next most likely is a loss of 10% or so. Least likely is a gain of 5% to 10%, although still a possibility.
Norwood owns good companies on sale (profitable, good balance sheets, above-average dividends). We have half a dozen companies on our watch list. We are buying bonds for the first time since 2020 (not a recommendation). We are also adding to our emerging market exposure (also not a recommendation).
Economic Indicators
Home prices are falling. The S&P Case Shiller U.S. home price index showed a decline of 3.1% in October. It fell 9.8% in September. Pending home sales dropped 4.0% in November after declining 4.7% the prior month. Continuing jobless claims rose to 1.71 million the week of 17 December up from 1.67 million the prior week. The continuing claims number is the highest since February. Rising continuing claims is a sign it is taking longer for workers to find new jobs.
The Chicago PMI was 44.9 in December up from 37.2 in November. A number below 50 indicates contraction.
Economic data continues to show a slowing economy. Still, the Atlanta Fed’s GDPNow forecast for Q4 has risen to 3.7% from 2.7%. It is possible we’ll get an upside surprise to the fourth quarter GDP. A hot reading will likely tank both the bond and stock markets. Investors will sell both in the belief the Fed will stay aggressive. The next update to the Atlanta Fed’s GDPNow forecast is 3 January.
A 60/40 stock bond portfolio
I often see 60/40 portfolios when meeting with prospects. It’s been the default all-weather portfolio for more than 40 years.
Most financial advisors are client relationship people. They are good at interacting with people and gaining their trust. They are good at sales. The investing parts? Not so much. Merrill Lynch, Morgan Stanley, Edward Jones, UBS, Wells Fargo, and Chase all hire financial advisors who know how to sell. The corporate mothership gives them enough guidance to keep them out of trouble. Financial advisors are given rules to follow on both allocation and investment selection. It helps ensure advisors don't deviate much from the markets. Stealth indexing at its finest. Mediocrity is okay, blowing up a client's portfolio is not.
The uniformity in the industry is substantial. If you’ve seen one wirehouse broker's portfolio you’ve seen them all. Yes, the allocation might vary a small amount, but a small amount only. And the 60/40 stock bond portfolio is the starting point.
A financial advisor who has a client that wants to take more risk is going to put them in a 70/30 stock bond portfolio. An advisor with a conservative client is going to allocate to 50/50. Hard to get hurt too badly with a 60/40 allocation if you buy the market. And of course, that’s what they do. No controversial stocks need apply. Buy Apple, Microsoft, Amazon, and put the rest in mutual funds that stealth index. Life is good.
Except when the 60/40 portfolio stops working, as it has now. The 60/40 stock bond portfolio lost around 20% in 2022. Stocks got clobbered. Bonds got clobbered. Life is not good. The question though is whether life will return to normal in future years. There’s a good chance the answer is no, for at least the next decade or so.
Inflation is not going back into the 2% bottle. The U.S. has too much debt to tolerate 1%-2% real interest rates. Low and negative real interest rates will ensure inflation percolates. The U.S. needs inflation to help pay down its debt. Bonds are likely to underperform over the next decade as a result. The 60/40 stock bond portfolio is likely to underperform by extension.
Investors will do better owning stodgy value stocks paying nice dividends. Underweighting bonds (after the next decline in yields) will add value. A portfolio that fades bonds in favor of 4% dividend-paying stocks will outperform on a risk-adjusted basis in the coming decade.
Regards,
Christopher R Norwood, CFA
Chief Market Strategist