No matter the market, Norwood buys good companies on sale

Market Update
The S&P 500 gained 1.45% finishing the week at 3895.08. The Nasdaq rose 0.98% and the Dow was up 1.46%. All the week’s gains came on Friday. The supposed catalyst was a “just right” jobs report. Barron’s described it as, “a growing-but-slowing labor market, a tick-up in participation, and a deceleration in the pace of wage gains.” We will see if there is follow through Monday. The tight trading range of the last few weeks argues for a breakout or breakdown in the next week or two. Low volatility begets high volatility.
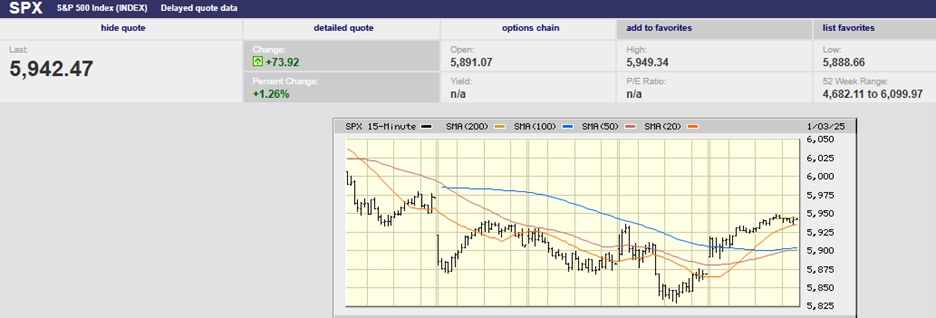
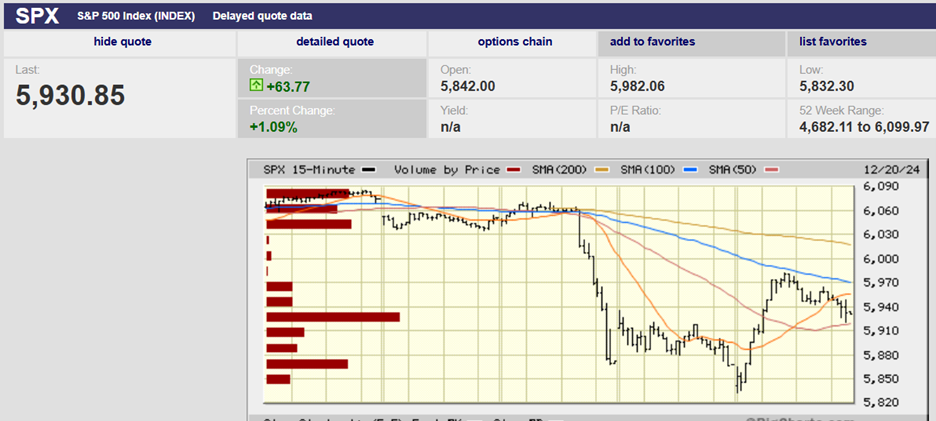
The S&P has found support at 3,800. The index first touched 3,800 on 19 December after failing twice to break above 4,100. It hit 4,100 on 1 December and again on 13 December. The index sold off to a low of 3,764 on 22 December after failing to break above 4,100. It has traded in a tight range since. Lows for the S&P starting on 19 December have been 3800.04, 3795.62, 3839.49, 3764.49, 3797.01, 3813.22, 3780.78, 3805.45. 3800.34, 3794.33, 3815.77, 3802.42, and 3809.56. The S&P has traded as high as 3906.19 during that period and that was on Friday. It’s a fair bet that the market will move sharply one way or the other in the next few weeks.
The odds favor down for the next major market move. Earnings season starts this week. Earnings estimates are too high for 2023. Fourth-quarter estimates have come down substantially already. Earnings are expected to decline 2.2% year over year to $53.87, according to Refinitiv. Analysts were calling for a 14.1% increase in earnings in Q4 at the beginning of last year. The bar might have been lowered enough that Q4 earnings don’t disappoint. Guidance for the rest of the year is another matter.
The consensus FY23 earnings estimate is $229.52, or 4.4% growth. We are more likely to see earnings decline in FY23 than grow. The market is not pricing in an earnings decline. Guidance during the earnings calls will be the key. Optimistic guidance might keep the market afloat through earnings season. Pessimistic guidance will almost certainly sink it. Regardless, Norwood Economics will continue to look for good companies on sale to buy.
Economic Indicators
The U.S. economy continues to grow slowly, or maybe not so slowly if the Atlanta Fed’s GDPNow forecast is accurate. The GDPNow model is predicting 3.8% economic growth in Q4. Third quarter GDP grew 3.2% after the second quarter GDP fell 0.6%. The economy looks to be accelerating. The labor market remains strong as well.
Yet there are signs of weakness too. The housing market has slowed and prices are starting to fall. Auto industry sales are falling also. Motor vehicle sales were 13.3 million annualized in December down from 14.2 million in November.
The manufacturing and services PMIs also show contraction. The S&P U.S. manufacturing PMI was 46.2 in December. The S&P U.S. services PMI was 44.7 in December. The ISM services index was 49.6 in December down from 56.5 in November. Economists expected 55.1. The ISM services index reading was the first to show contraction since early in the pandemic. (Numbers below 50 mean contraction). The new orders index fell 10.8 points to 45.2. New orders are a leading indicator. The ISM manufacturing index was already showing contraction. The most recent reading was 48.40.
It appears as if the economy grew strongly through much of Q4 but may have hit a speed bump late in the quarter. Both the economy and stock market are at crossroads. Uncertainty is high, which usually leads to volatility.
Three Conversations
I love my job for the variety it brings. Researching stocks is fun. Tracking the economy is fascinating, a puzzle to be solved. Working with clients to help them achieve a successful retirement is rewarding.
I had three conversations with clients last week that are worth sharing. Two of the conversations were about fixed-income investing. The third was about picking the better mutual fund.
Money market funds anchor their share price at $1. The interest rate paid moves up and down depending on changes in the yield curve. “Breaking the buck” is a no-no in the world of money markets. Fidelity has a money market fund with a 7-day yield of 4.26% as of Friday. The net expense is 0.3%. The Fidelity money market fund earned 1.28% over the last year versus 2.13% for 3-month T-bills. It earned 1.14% on average over the prior five years versus 1.34% for 3-month T-bills. The money market yield will go higher if short-term interest rates continue to climb. The yield will fall if rates decline. The share price will remain $1 regardless.
Bond prices rise when yields fall and fall when yields rise. It is basic math. A bond has a coupon that is paid twice per year. The coupon amount is fixed for the life of the bond, which is why yield and price move opposite one another. Norwood has been underweight bonds since March 2020. We are buying short-term Treasuries and short-term inflation-protected Treasuries now. (Not a recommendation). Vanguard's Short-Term Treasury Index ETF yields 4.43% as of Friday, a bit more than the Fidelity money market fund.
We are buying bonds rather than investing in money market funds. The yield is higher. More importantly, there should be capital gains one to two years out as yields fall. Interest rates are near their peak for this cycle. Yields will likely fall in 2023 and 2024. Falling yields mean rising bond prices. Capital gains are part of total return. There is more risk in buying Treasuries than investing in money market funds. There is also potentially more reward.
The third conversation was about comparing American Funds New World fund (RNWGX) to Vanguard Emerging Market Index fund (VEMAX). New World is categorized as a diversified emerging market fund. On the surface the two funds are in the same space, emerging market stocks. Turns out they aren’t really though.
RNWGX must only have 35% of its assets in emerging markets. It currently has 25% of its assets in U.S. stocks. Microsoft is its largest position. VEMAX is 100% emerging markets. It tracks the FTSE Emerging Markets All Cap China A Inclusion Index. RNWGX is a large-cap growth fund. VEMAX is a large-cap blend fund. Finally, VEMAX has a 0.14% expense ratio while RNWGX has a 0.57% expense ratio. Investors looking for low-cost exposure to emerging markets should favor VEMAX over RNWGX.
Regards,
Christopher R Norwood, CFA
Chief Market Strategist
