Executive Summary
- The stock market's best week since Donald Trump’s re-election in November
- The S&P 500 rose 2.91%
- The CME FedWatch tool is predicting one cut in 2025
- The fundamental narrative was all about inflation
- Earnings season is in full swing starting this week
- Higher than-expected interest rates and inflation might put downward pressure on stocks.
- Inflation expectations have been rising
- 2025 is likely to be a volatile year for the capital markets
- Deglobalization means higher inflation
The Stock Market
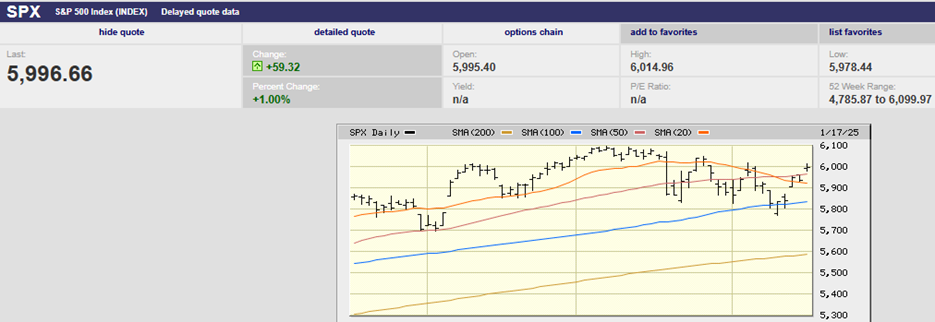
The stock market closed out the Biden era with a bang. It was the best week since Donald Trump’s re-election in November, according to Barron’s. The S&P 500 rose 2.91% to finish at 5,996.66. The Nasdaq gained 2.45% and the Dow 3.69%. Bond yields fell, with the two-year yield ending the week at 4.30%. The 10-year Treasury yield finished the week at 4.63%. The two-year yield most closely tracks the Fed funds rate. The funds rate is 4.25%-4.50% and is expected to stay there when the Fed meets in two weeks. The two-year Treasury is 4.30% and the average Fed funds rate is 4.375%. Bond investors don’t see the Fed cutting again any time soon. The CME FedWatch tool is predicting one cut in 2025, sometime around mid-year.
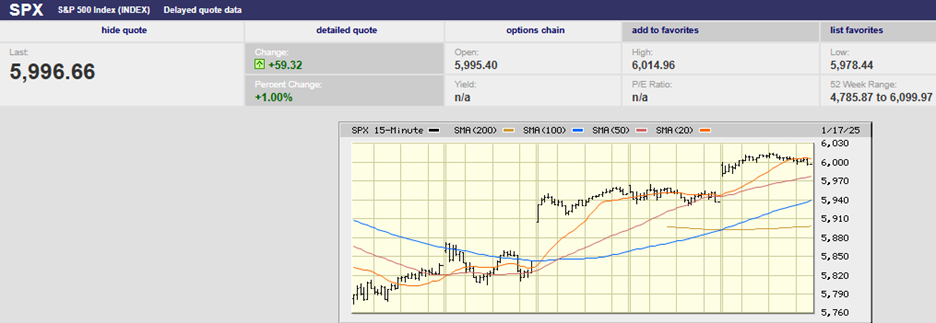
S&P 500 5-day chart
Last week’s trading felt like a relief rally. Gap-up openings with little follow-through are a classic sign of a contra-trend. We can expect selling in the coming week if last week was a relief rally.
S&P 500 3-month chart
The S&P closed the previous Friday at the 100-day moving average after falling below earlier in the day. A gap down open on Monday took the S&P back below the 100-day moving average. Investors bought the down open. The index closed near its high for the day and back above the 100-day. Investors tested the downside again on Tuesday, pushing the S&P back below the 100-day yet again. The index reclaimed the 100-day before the close though. All in all, the index held the 100-day M.A. over a three-day period. It was enough to trigger the relief rally beginning on Wednesday. That’s the technical narrative.
The fundamental narrative is all about inflation. The CPI report was better than expected Wednesday morning. It came out before the market opened. ING Financial had this to say about the CPI report, “The US CPI number was better than expected, but it was not a good report.” The CPI accelerated to 0.4% for December from 0.3% in November. Core CPI did fall to 3.2% year-over-year in December. Core CPI year-over-year had held at 3.3% in the prior three months. The latest core CPI number was actually 3.248%. Another two one-thousandths and the core CPI would have been rounded to 3.3%, not down to 3.2%. Core CPI beat expectations by an insignificant amount. That's the fundamental narrative.
Regardless, investors chose to buy the open on Wednesday. The S&P hit resistance at the 50-day moving average, capping its gains on Wednesday. The market high on Thursday was also stopped by the 50-day. A gap up open Friday allowed the S&P to finally clear the 50-day. The big round 6,000 number stopped the advance for the week. Resistance lies between 6,000 and 6,100.
If the above trading sounds mechanical, it’s because it was. The moving averages controlled trading all five days last week.
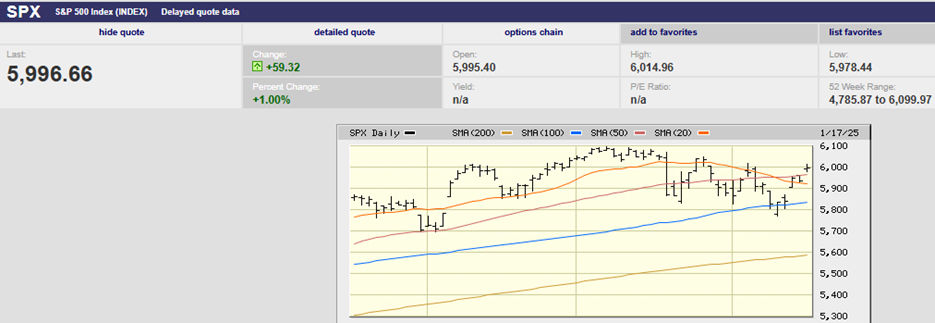
Take another look at the S&P 500 3-month chart above.
The mechanical nature of the price action means the possibility of a trading range. The S&P might well stay between 5,800 and 6,100 for at least the next couple of weeks. The S&P might even move sideways for the next few months as fundamentals sort themselves out. The earnings season is the biggest fundamental that needs sorting currently. Worse than expected earnings and guidance could trigger a correction. A better-than-expected earnings season could send the market trending higher.
In fact, earnings season is in full swing starting this week. The big banks reported last week and those reports were well received. Earnings growth estimates remain bullish for 2025. S&P 500 earnings are expected to grow 12.3% in 2025. As usual, the year is back-end loaded with a Q4 earnings growth forecast of 16.5%.
Real GDP growth now appears to be accelerating at a 3% pace. Steven Ricchiuto and Alex Pelle for Mizuho Securities made that point in a note to clients last week. The Atlanta Fed GDPNow tool estimate is 3.0% for Q4 as of 17 January. The estimate has been rising in the last few weeks.

Other sources have an average estimate of 2.4% for Q4 GDP. (The Fed is on record as believing 1.8% growth is the non-inflationary growth rate.)
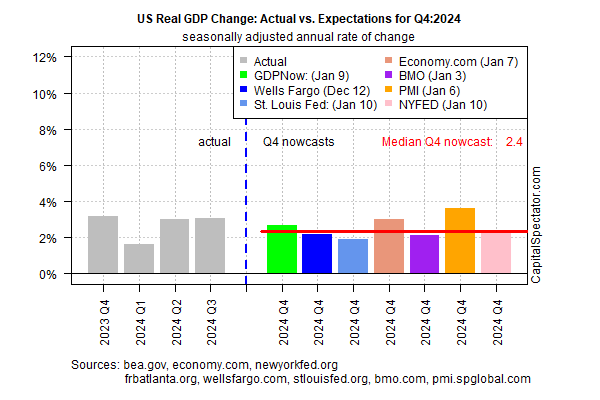
The median Q4 nowcast is 2.4% (see chart above)
But then there are rising interest rates and slowing disinflation to consider. Higher than-expected interest rates and inflation might put downward pressure on stocks. Evercore ISI’s strategy team led by Julian Emmanuel is focused on rising Treasury yields. “Treasury yields have been a key variable for stocks,” they write. “A rise above 4.5% on the 10-year note poses a “surmountable headwind,” while 4.75% would point to a “deeper correction” and 5% to a “bull market threat.”
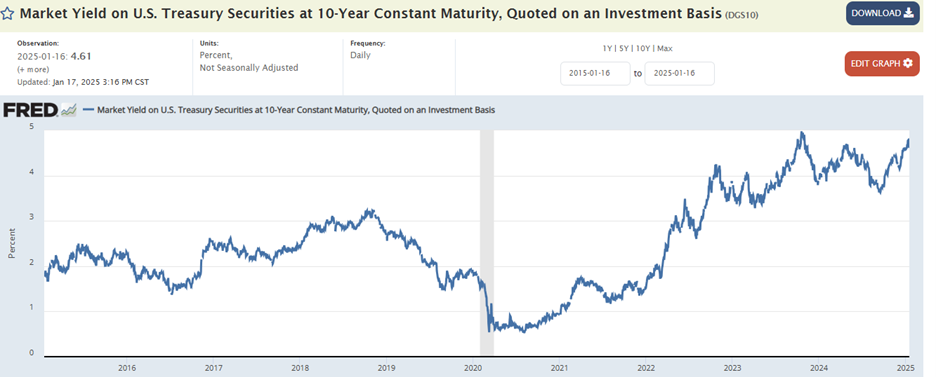
A 5% 10-Year Treasury yield is high compared to the last decade (chart above)
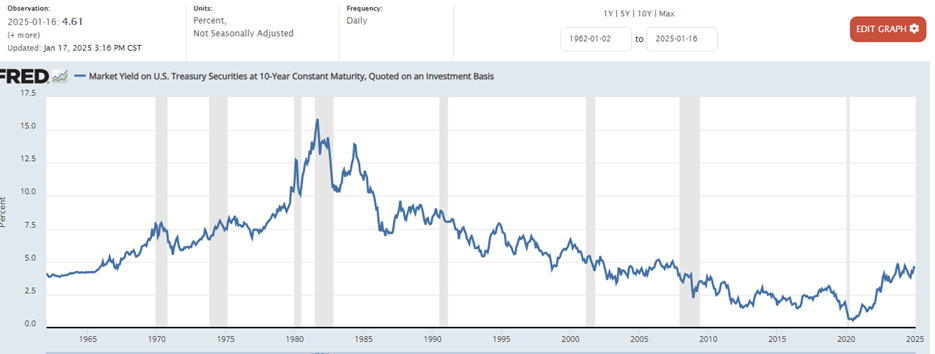
10-year yields don’t look as high going back to 1962 (chart above). Interest rates have plenty of room to move higher in the coming years if inflation doesn’t behave.
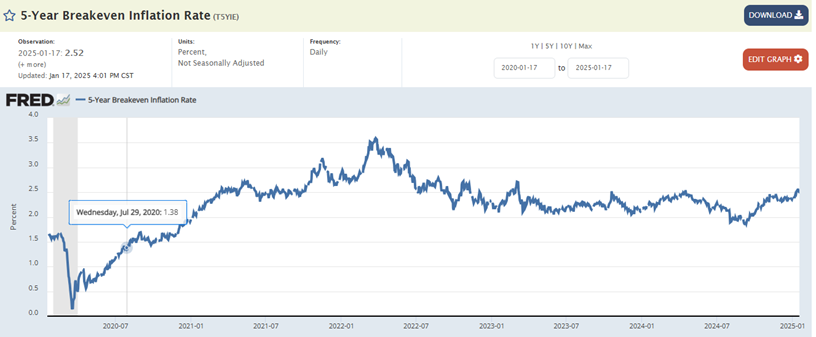
Mott Capital Management points to one and two-year inflation swaps as a warning for higher Treasury yields. Swaps have climbed to high levels compared to the past two years, according to Michael Kramer of MCM. “These levels are dangerously high because if they continue to climb, they will move out of what has been a well-established trading base over that time,” Kramer wrote recently.
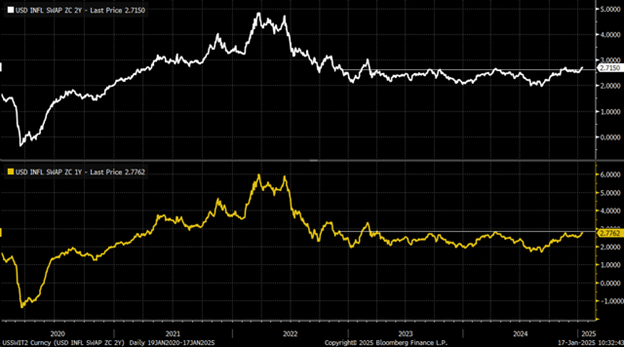
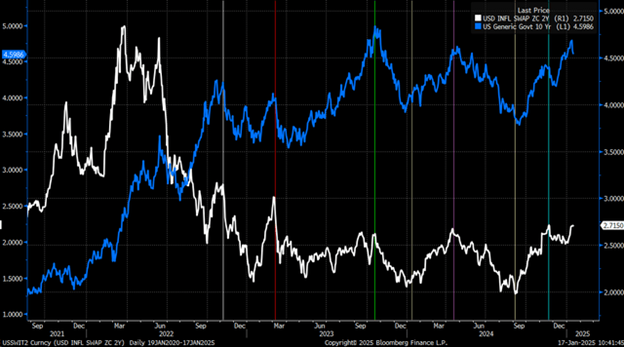
Two-year inflation swaps move with bond yields. Rising inflation swaps make it more likely that yields will continue to rise as well. (See below Chart)
Inflation and interest rates tend to rise and fall together. The real yield is the real cost of money. (The real yield is the nominal yield minus inflation).
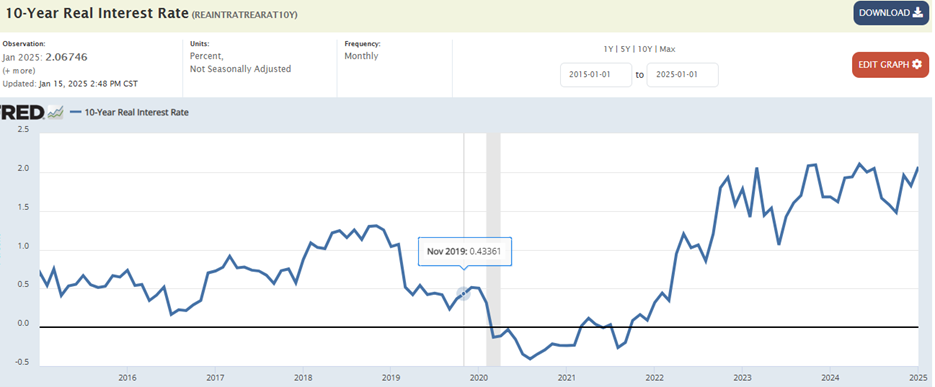
The cost of money is rising. The real yield is higher than it’s been in a decade.
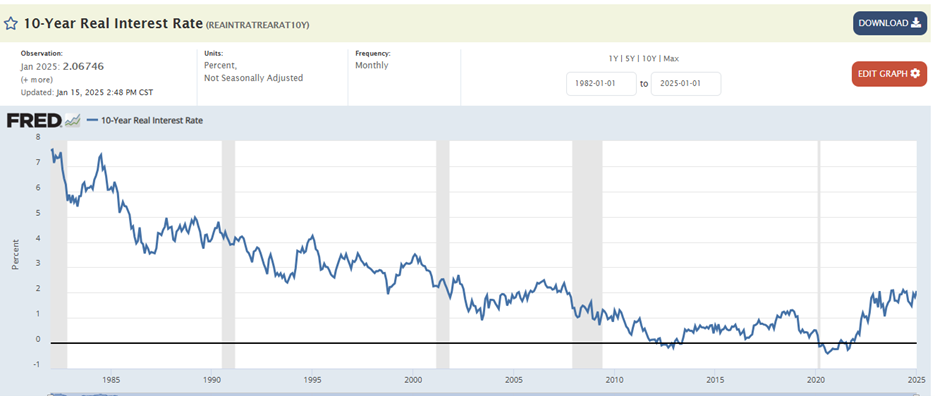
The real yield has been much higher though when looking at the longer term. (Chart Above). Makes you wonder how the leveraged players in the various capital markets are handling the higher cost of money.
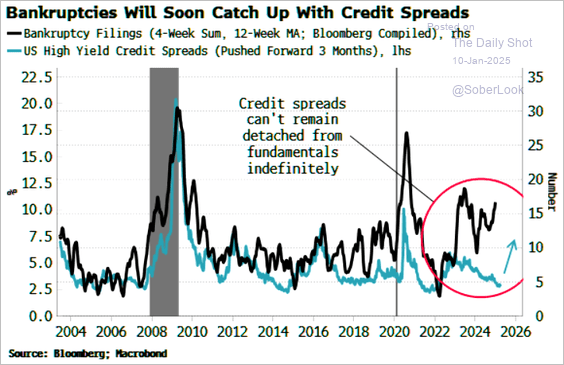
A widening spread between Treasury and Junk bond yields is one of the earliest signals of stress in the credit markets. A widening spread means credit markets are pricing in higher risks. Corporate bankruptcies have increased sharply over the last two years. Borrowing costs are rising making debt service more difficult. Credit spreads have yet to reflect this reality, according to Lance Roberts of RIA Pro
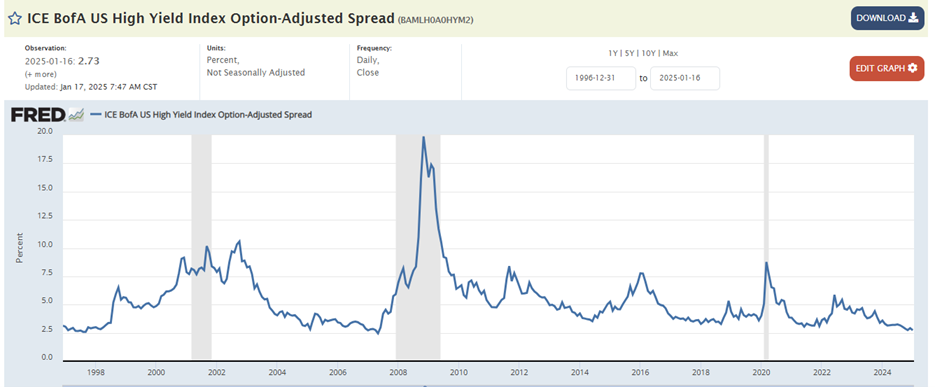
The ICE BofA US High Yield Index Option Adjusted Spread mid-90s to present
Inflation is a variable that stock investors haven’t had to deal with often over the last 25 years. The inflation that arose in 2021 and peaked at 8.0% in 2022 was a shock. Investors had gotten used to a low inflation, low interest rate environment. The hope even now is that inflation will fall to 2% and remain there. The reality may well be very different.
John Ryding and Conrad DeQuadros are economic advisors for Brean Capital. They pointed out recently that the so-called core inflation year-over-year trend has stalled at around 3.2% in the second half of 2024. Mark Zandi Chief Economist of Moody’s Analytics thinks the incoming Trump administration may add to inflationary pressures. He believes plans for new tariffs, deportations, and deficit-funded tax cuts “will do harm. How much … depends on how aggressively these policies are pursued.”
Inflation expectations have been rising.
The stock market in 2025 will react to earnings growth. Earnings estimates are aggressively bullish. It will also react to long-term interest rates if yields move overly much in either direction. A fall in long-term rates will likely lead to a continuation of the strong uptrend that began in the fall of 2022. A push above 5% or so in 10-year Treasury yields could easily trigger a correction, perhaps a deep one. The odds favor long-term rates continuing to rise. That might happen, or not, depending on what the Fed, Congress, and Trump do. What we can say with more confidence is that 2025 is likely to be a volatile year for the capital markets.
Inflationary Headwinds
Inflation is always and everywhere a monetary phenomenon. Or so famously said Nobel Laurette Milton Friedman. Except sometimes it isn’t at the micro-economic level.
Deglobalization is one of the headwinds that will keep inflation higher than otherwise. Taiwan Semiconductor (TSM) highlights how deglobalization is adding to inflationary pressures.
TSM Chairman and CEO C.C. Wei said that the company's new U.S. facility is not likely to receive the latest chip technology before facilities in Taiwan because of compliance issues, domestic construction rules, and several permit requirements, Reuters reported.
Bullets from the article:
- Wei noted that establishing the new facility in Arizona has taken about twice the time than in Taiwan.
- Wei said at the university event that a shortage of skilled workers, gaps in the supply chain, and lack of rules involving chip facility construction, have extended the timeline for its Arizona project.
- "We ended up establishing 18,000 rules, which cost us $35 million," said Wei.
- Wei said that the chemical supply costs in the U.S. are five times those in Taiwan, causing TSM to ship sulfuric acid from Taiwan to Los Angeles and then ship it to Arizona.
- A shortage of labor also led to challenges, which saw TSM bringing half of the construction workers from Texas to Arizona. This led to a rise in costs because of relocation and accommodation, Wei noted.
Welcome to deglobalization and higher prices….
Regards,
Christopher R Norwood, CFA
Chief Market Strategist