ANNUITIES ARE BEST USED AS A WAY OF LOCKING IN GUARANTEED CASH FLOW
April 24, 2019
Guaranteed Cash Flow — Fishers, IN — Norwood Economics

ANNUITIES ARE MISUNDERSTOOD INVESTMENTS

What's the annuity puzzle?

FROM THE BLEACHERS, VOL. 16

MARKET UPDATE

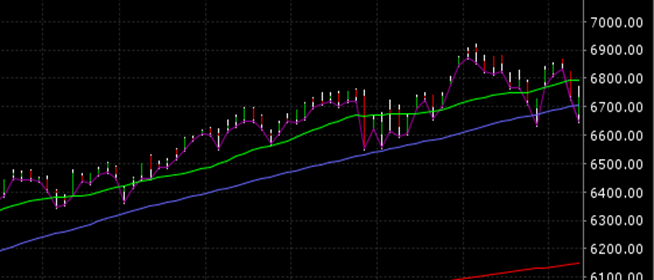
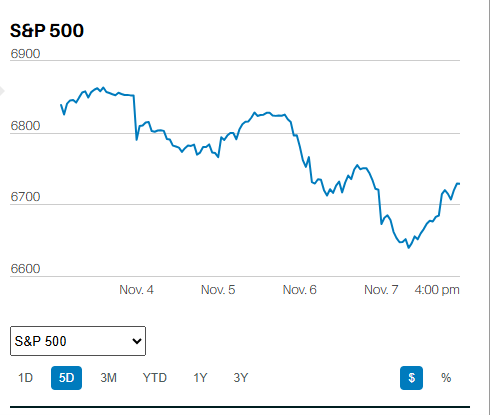
The S&P 500 is up about 61% over the last three years. However, it hasn’t really gone anywhere in over a year. The S&P 500 hit a high of 2873 on January 26th of 2018 before selling off sharply to a low in the vicinity of 2533 on February 9th of 2018. It did surpass its old high by late August of 2018 only to sell off again, more substantially, beginning in early October and culminating in the December 24th low at around 2347. Now the S&P 500 index is sitting at 2905, close to its all time high of 2941, but also basically where it was over a year ago. Technicians might be inclined to see a triple top that will eventually resolve itself as a bear market. They might be of a more bullish bent and see a period of healthy consolidation leading to an eventual breakout to the upside. Humans have long looked for portends of things to come in the entrails of animals, the flames of a campfire, the configuration of stars in the sky. Humans have also shown themselves to be impervious to facts, mostly incapable of changing their views when new facts emerge. Beliefs are rarely changed, preconceived notions almost never swayed. We know what we know because. . .well, because we know it.


The truth about patterns is that they are only patterns after they are created. What has come before doesn’t help us with what will come in the future. Fractal geometry appears to describe the patterns in nature far better than traditional geometry. Fractals are never ending irregular patterns that have the same degree of irregularity regardless of scale. What that means for measuring the coastline of the British Isles is that every measurement is merely an estimate, an estimate that changes as the scale of measurement changes; the same patterns occur in the stock market. Change the scale (time period) and you change the pattern. Look at a 2-year chart of the S&P 500 and you see perhaps a triple top forming. Look at a 10-year chart and you see an uptrend that includes what looks like a topping pattern of a bit more than a year from late 2014 until early 2016 but wasn’t. Is the last year of S&P 500 activity a topping pattern or merely the pause that refreshes?


The reality is that we are still waiting for the S&P 500 to resume its 10-year old bull market or begin the next bear market. No one really knows which will happen. Bonds are still indicating economic weakness, or at least slow growth. Corporate earnings are still expected to decline by 3.8% in Q1 and come in flat in Q2. On the other hand, the Atlanta Fed GDPNow forecast for Q1 was raised on Thursday to 2.8% and the Conference Board’s Index of Leading Economic Indicators increased by 0.4% in March, a level consistent with about 2.0% economic growth in 2019. 


We remain in a high-risk environment and people with spending goals in the next five years or so should continue to view portfolio risk through the prism of those spending goals. However, no one should be making changes to their asset allocations based on a guess about when the next bear market will begin.

INVESTING IN ANNUITIES

Annuities are one of the most misunderstood investments in the universe of investments. They are contracts between you and an insurance company. They are best used as a means of locking in a guaranteed amount of cash flow for a guaranteed period. The annuity puzzle was first identified by an Israeli economist named Menachem Yaari in the 1960s. The key problem dealt with by income annuities purchased at retirement is longevity risk – the risk of outliving your assets. The risk is increasing as life expectancies continue to rise. Moreover, the distribution of longevity is wide – a 22 year difference between the 10th and 90th percentile with men and a 23-year difference with women. Income annuities hedge longevity risk simply and efficiently as risk pooling makes them 25-40 percent cheaper than do-it-yourself options, according to Benartzi, Thaler, and Previtero in a paper published in the Journal of Economic Perspectives in the fall of 2011. As Benartzi, Thaler, and Previtero point out in their paper, “You increase your consumption and eliminate risk at the same time … Who says there is no thing as a free lunch?” Income annuities work their magic in the same manner as any insurance product by spreading risk among many people. Specifically, some retirees will die prematurely, thus subsidizing those retirees who live longer than expected. 


So what’s the annuity puzzle? Why so few people actually buy income annuities when they retire. We’ll write more about the annuity puzzle next week.


WARNING: Income annuities are extremely useful for locking in a guaranteed stream of income that allows retirees to spend more in retirement. Income annuities are a specific kind of fixed annuity. They should not be confused with variable annuities and other types of accumulation annuities that are typically expensive and very often fail to create as much wealth as one can create with a low cost, diversified portfolio of stocks, bonds, and real estate

By Christopher Norwood July 7, 2025
Executive Summary The S&P 500 rose 1.7% in a holiday-shortened week, finishing at 6,284.65 Volatility continues to fall from its elevated levels in early April The S&P is up 6.76% year-to-date. Industrials are leading the way, up 13.40% Price determines returns when buying an asset  Diversify away from a concentrated U.S. large-cap stock portfolio Job growth has been holding steady for almost a year now Analysts have been raising earnings estimates recently 90-day tariff suspension ends on Wednesday The Stock Market The S&P 500 rose 1.7% in a holiday-shortened week. The Nasdaq rose 1.6%. Both indexes set new record highs with the S&P reaching 6,284.65 on Thursday afternoon. The jobs report out Thursday spurred the S&P higher. The index gapped up at the open, closing Thursday up 0.83% (see chart below). The S&P 500 is up 26% from the selloff low on April 8, while the Nasdaq has surged 34.9%.
By Christopher Norwood June 30, 2025
Executive Summary The S&P 500 rose 3.4% last week, climbing to 6,173.07 The Magnificent 7 are outperforming the S&P 493 by over 18% since April The Cboe Volatility Index (VIX) fell as low as 16.11 last week Investors seem unconcerned about tariffs and war Treasury interest rates are starting to fall The Fed has little reason to cut if unemployment isn't moving higher The stock market is at record highs Corporate bond spreads are tight, meaning credit is abundant The dollar has fallen by around 10% in 2025 Inflation is expected to move higher because of tariff The Stock Market The S&P 500 rose 3.4% last week. The Israeli-Iranian ceasefire was credited with the surge to the upside. The index had lost 0.7% over the prior two weeks.
By Christopher Norwood June 23, 2025
Executive Summary The S&P 500 gained 0.3% last week, climbing to 5,967.84 The index is having trouble staying above 6,000 Technical indicators are turning somewhat negative The Federal Reserve kept the overnight rate at 4.25% - 4.50% The updated “dot plot” shows a divided Fed Seven members indicate no rate cuts in 2025 Eight members forecast two rate cuts in 2025 The Fed is forecasting a slower economy in 2025 and 2026 The hard data is starting to point to a slowing economy Inflation is still well above the Fed’s 2% target
By Christopher Norwood June 16, 2025
Executive Summary The S&P 500 fell 0.4% last week to finish at 5,976.97 Friday's sell-off due to Israel's attack on Iran The Volatility Index (VIX) is rising due to the war in the Middle East Higher volatility is usually associated with a down move in the market There is no chance of a Fed Funds Rate cut at this week’s meeting according to the CME FedWatch Tool The unemployment rate has been rising slowly The dollar continues to weaken The U.S. needs to reduce its spending to avoid a currency crisis  The Stock Market
By Christopher Norwood June 9, 2025
Executive Summary The S&P 500 rose 1.5% last week to finish at 6,000.36 The May payroll number came in above estimates The U.S. economy is slowing, despite the S&P 500 poking above 6,000 The Labor Force Participation Rate fell to 62.4% from 62.6% Inflation may have bottomed and is set to rise The services price paid index is pointing towards a higher CPI The declining dollar is a concern Tariffs are a tax The Q2 nowcast seems to be indicating that negative economic impacts from tariffs won’t affect Q2 International markets have far outperformed U.S. markets so far in 2025 The Stock Market The S&P 500 climbed 1.5% last week and closed at 6,000.36. The Dow rose 1.3% while the Nasdaq rose 2.0%. Interest rates rose as bond prices fell. A stronger-than-expected jobs report on Friday is getting the blame for rising yields. The jobs report was also responsible for the S&P’s gap-up open on Friday (chart below).
By Christopher Norwood June 2, 2025
Executive Summary The S&P 500 rose 1.9% last week to finish at 5911.69 The S&P 500 rose 6%, the Dow rose 3.8% and the Nasdaq climbed nearly10% in May Could see another test of support around 5,800 this week Several longer-term negative divergences may be pointing to a tough summer Declining new highs during an advancing market is a negative Earnings estimates for 2025 and 2026 have been trending lower Earnings drive the stock market over the long run
By Christopher Norwood June 2, 2025
Executive Summary The S&P 500 fell 2.6% last week to close at 5,802.82. The 20-Year Treasury auction went poorly. The yield rose above 5%. The 5% threshold has twice this year resulted in the administration adjusting its stance on tariffs. (Make that three times as Trump over the weekend gives the U.K. until July 9 th .) Longer-term inflation expectations are rising. Moody’s downgraded the U.S. to Aa1 on 16 May. The credit default swaps market sees the U.S. as a Baa1/BBB+ credit, on par with Greece. The tax cut bill will add to the deficits and debt. Long-term interest rates might well continue to rise.
By Christopher Norwood May 19, 2025
Executive Summary The S&P 500 rose 5.3% last week to finish at 5,958.38 The Dow advanced 3.4% and the Nasdaq added 7.2% A falling VIX means investor confidence is increasing A 90-day pause in the trade war sent the S&P higher Earnings estimates are falling along with GDP growth forecasts Earnings and interest rates drive the stock market over the long run Investors are chasing performance Small business hiring plans and job openings haven’t improved Norwood Economics continues to look for good companies on sale The Stock Market
By Christopher Norwood May 19, 2025
Executive Summary The S&P 500 fell 0.5%, to finish at 5,659.91 The Dow fell 0.3%, and the Nasdaq dropped 0.5% The 200-day moving average is the next resistance U.S. nominal GDP growth expected to slow significantly Bank of America shifts investment focus Norwood Economics already has exposure to gold for most clients Norwood Economics is overweight international stocks The risk of both higher unemployment and higher inflation has increased The Federal Reserve declined to lower the fed funds rate last week The Stock Market
By Christopher Norwood May 5, 2025
Executive Summary The S&P 500 rose 2.9% last week to finish at 5,686.67 The Dow was up 3% last week, and the Nasdaq rose 3.4% The counter-trend rally is ongoing Investors are extremely bearish due to worries about the trade war Political prediction markets are back Exploding imports are not a sign of weakening demand The April jobs report was better than expected The Trade War continues Capital is flowing into international and emerging markets The US dollar will likely continue to weaken The Stock Market
More Posts