Asset Allocation Changes To Our Portfolios
September 25, 2018
Cubes of Dollars and Percent on Scales Balance — Fishers, IN — Norwood Economics

Norwood Economics has reduced interest rate and credit risk in its 401(k) and wealth management portfolios.


 The changes were made in response to changing conditions in the economy. 


There are risks associated with investing in bonds. Two main risks of investing in bonds are interest rate risk and credit risk. Rising interest rates result in falling bond prices, and falling interest rates result in rising bond prices. Bonds with longer maturities are more sensitive to changes in interest rates than bonds with shorter maturities. Duration is a measure of a bond’s price sensitivity to changes in interest rates. Duration is expressed in years. 


For example, a 10-year Treasury has a duration of approximately 8.5 years, which means a 1% rise in 10-year interest rates leads to an 8.5% decline in the price of the bond. A 30-year Treasury has duration of approximately 19.3 years. A 2-year Treasury has duration of approximately 1.9 years. Two-year Treasuries will lose only 1.9% if rates rise by 1% while 30-year Treasuries will lose 19.3% if rates rise by 1%. Clearly, it is better to own higher duration bonds in a falling interest rate environment, and lower duration bonds in a rising interest rate environment. 


Interest rates are still near all-time lows, even with the recent rise (mostly at the short end of the yield curve). It is highly likely that interest rates will be substantially higher in 10-years, for a variety of reasons, including rising inflation and rising government debt levels.

Asset Allocation Change Graph 1 — Fishers, IN — Norwood Economics

We’ve sharply lowered duration in our portfolios because 1) the yield curve has flattened to a point where investors aren’t receiving much additional yield for taking on interest rate risk 2) interest rates are likely to rise over the next 10-years, putting pressure on bond prices and resulting in potentially large losses to bond holders.


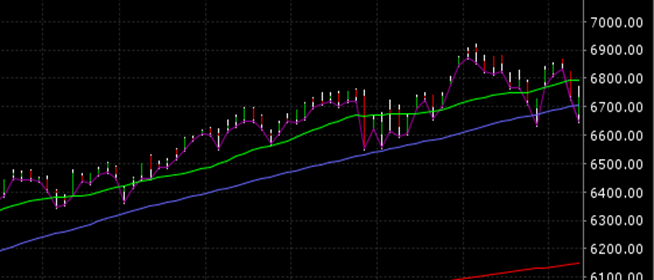
Credit risk is another main risk of bond investing. Treasuries are risk free and thus act as the benchmark for credit risk in the bond market. All other types of bonds trade at a spread above Treasuries, commensurate with the amount of credit risk associated with each bond. Corporate investment grade bonds have less credit risk than high-yield, non-investment grade bonds and thus trade at a tighter spread over Treasuries than do high-yield bonds. Corporate investment grade and high yield spreads are currently tight.

Asset Allocation Change Graph 2 — Fishers, IN — Norwood Economics

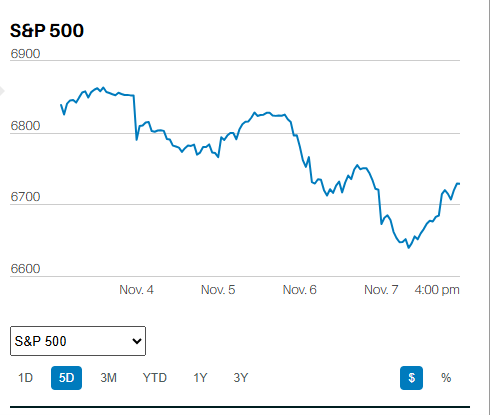
Investment Grade corporates are starting to trend higher (see above). High Yield spreads are still trending lower (see below). However both investment grade and high yield spreads are near 20-year lows.

Asset Allocation Change Graph 3 — Fishers, IN — Norwood Economics

Additionally, there has been a large increase in BBB rated corporate debt since the Great Recession. Triple B debt is the lowest rated investment grade debt. The BBB corporate bond market has ballooned from $700 billion to $3 trillion since the last recession. Investors typically think of investment grade debt as low-risk and most are likely unaware that BBB corporate debt now makes up almost half of the $6 trillion investment grade corporate bond market. It is likely that downgrades to junk (high-yield) will catch many investors by surprise as BBB rated companies struggle with meeting interest and especially principal payments during the next recession, as corporate cash flows come under pressure from deteriorating economic conditions.


Norwood Economics has recently reduced credit risk in our wealth management portfolios by shifting from corporate investment grade index ETFs to bond index ETFs holding primarily government debt. Corporate debt is trading near 20-year lows to government bonds. Credit risk is rising inside the investment grade universe as BBB bonds continue to make up a larger and larger percentage of investment grade debt. We expect a recession sometime within the next few years – likely the second half of 2019 or first half of 2020. Downgrades and defaults will increase and corporate bond prices with adjust downward accordingly with corporate spreads widening to more normal levels.

By Christopher Norwood February 17, 2025
Executive Summary The S&P finished the week at 6,114.69 The 2-year yield hit 4.38% after the Consumer Price Index (CPI) was released on Wednesday, but ended the week at 4.27% Investors dumped stocks when the CPI report was released Producer Price Index (PPI) has accelerated for five straight months PPI is a leading indicator of consumer inflation Inflation expectations are rising among fixed-income investors The 5- &10-year breakevens are rising The Stock Market
By Christopher Norwood February 10, 2025
Executive Summary The S&P finished the week at 6025.99 The S&P has been trading sideways since 11 November Volatility (VIX) has spiked five times since last fall each time falling quickly back to mid-teen levels Microsoft, Alphabet, and Amazon have contributed to the negative tone with cautious guidance The Equity Risk Premium has been falling over the last 14 years Bonds have been a horrible investment over the last three, five, and ten years The jobs market continues to show strength Consumers' inflation expectations are increasing The stock market is expensive and will return less than its long-term average over the next decade Good stock picking will be critical if investors are to earn a return close to the long run average. The equity risk premium is too low which may make Treasury bonds a better investment than stocks on a risk adjusted basis over the next decade. Treasury bonds may outperform stocks over the next decade but not necessarily over the next few years since the 10-Year could rise another 100 basis points in the short term. The Stock Market
By Christopher Norwood February 3, 2025
Executive Summary The S&P fell 1% last week, closing Friday at 6,040.53 The index hasn’t been able to break clear of resistance The AI space took a big hit Monday Tariffs on Canada, Mexico, and China GDP grew 2.3% annually in Q4 The futures market expected the funds rate to remain at 4.25-4.50% and it did The employment cost index (ECI) for Q4 2024 rose 0.9% QoQ Pending home sales took a hit in December The stock market continues to trend higher There is a relationship between the stock market and the economy More Interesting Charts to review 
By Christopher Norwood January 27, 2025
Executive Summary The S&P hit a new high on Thursday, reaching 6,128.18. The Volatility Index (VIX) fell to a low of 14.85 The VIX has declined sharply from 27.6 The 5.4% decline from 6 December to 13 January doesn’t qualify as a correction Watch Earnings, Inflation, and Interest Rates for the stock market's near-term direction Don't miss the Charts Worth Seeing at the bottom
By Christopher Norwood January 20, 2025
Executive Summary The stock market's best week since Donald Trump’s re-election in November The S&P 500 rose 2.91% The CME FedWatch tool is predicting one cut in 2025 The fundamental narrative was all about inflation Earnings season is in full swing starting this week Higher than-expected interest rates and inflation might put downward pressure on stocks. Inflation expectations have been rising 2025 is likely to be a volatile year for the capital markets Deglobalization means higher inflation
By Christopher Norwood January 13, 2025
Executive Summary The jobs report on Friday sparked stock and bond market selling Economic data hasn't justified rate cuts The Bond market has been signaling its disagreement with the Fed since the September cut The 10-year Treasury Yield is rising. Bond investors see inflation risks The Jobs market is strong Disinflation is slowing Investors should expect more volatility in 2025 Diversification means less portfolio volatility but also lower returns True diversification means always owning something that is underperforming  Diversified portfolios will trail during a bull market
By Christopher Norwood January 6, 2025
Executive Summary The Santa Claus rally was a no-show this year Friday's jobs report might bring volatility Economic data continues to point toward a strong economy The stock market is near all-time highs Corporate bond spreads are near record tights Liquidity is abundant No signs of a recession. The Fed is backing away from aggressive rate cuts. Inflation concerns are re-emerging  2024 in Review
By Christopher Norwood December 23, 2024
Executive Summary The Stock Market dropped 2% last week The Dow ended its losing streak at 10 The Fed cut interest rates by a quarter-point last Wednesday Fewer rate cuts could mean slower economic growth and slower earnings growth Apollo’s chief economist Torsten Sløk predicts a 40% chance of Fed rate hikes in 2025 Value stocks continue to lag growth stocks and the overall market Value will make a comeback. It always does. History doesn’t repeat itself, but it often rhymes~ Mark Twain
By Christopher Norwood December 16, 2024
Executive Summary 50-years of S&P 500 data The Dow ended Friday on a seven-day losing streak 96% chance the Fed will cut by 0.25% this week Stock market strategists are expecting more S&P 500 gains in 2025 Value Investing Outperforms over the Long Run Value can be found in international and emerging markets today Value can be found in the U.S. stock market, but it takes patience
By Christopher Norwood December 9, 2024
Executive Summary Jobless claims report higher than forecast The Cboe Volatility Index (VIX) fell to 12.77, that's low Why is the Fed cutting at all? The S&P likely to finish the year above its current level The 10-year & 2-year Treasury yield are falling The Fed continues cutting despite a strong jobs market and high inflation Investors should look at the “low-flyer” companies that represent better value Mental Accounting and Risk 
More Posts
Share by: