Huge Deficits Must Stop
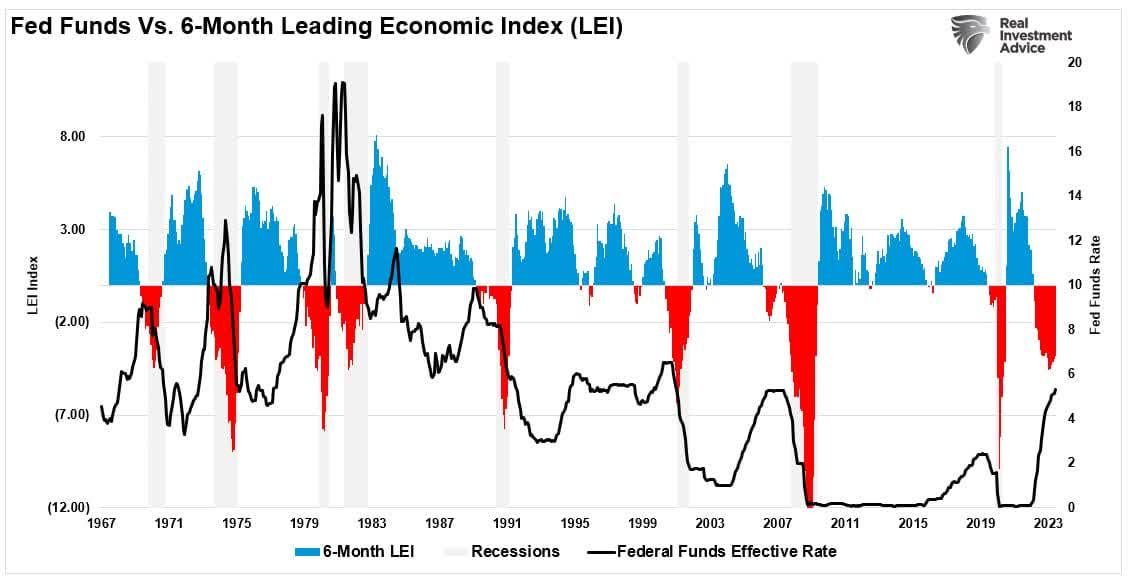
A declining Leading Economics Indicator (LEI) and rising Feds Funds Rate means recession.
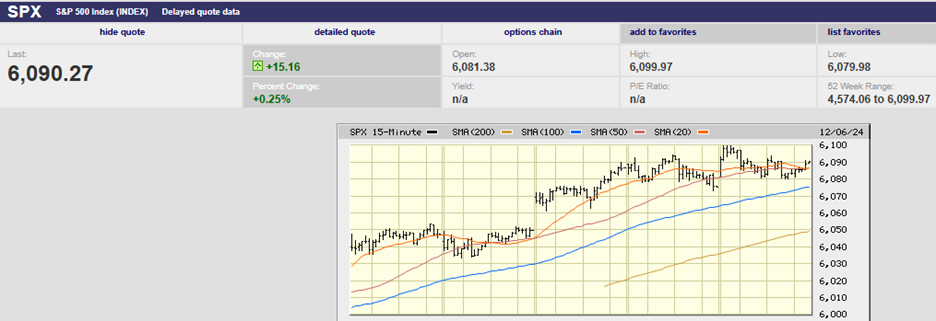
Market Update
The S&P 500 fell 0.74% last week to finish at 4288.05. The 4335.31 August low is now the first resistance. The index was down 4.87% in September. It was its worst month since December of 2022. The Nasdaq dropped 5.81% in September. It did manage to gain 0.06% last week. The S&P could bounce to 4,400 in the next few weeks. First, it must conquer 4,335 - 4,340. The 100-day is just below 4,400. The 20-day at 4,400. The 50-day is at 4,450. All three moving averages represent resistance.
The index isn’t oversold yet. The volatility index has spiked from low levels recently. The VIX rose from 12.68 on 15 September to a high of 19.71 on the 27th. The VIX will need to rise above 30 before the S&P finds a longer-term bottom. For now, the short-term trend is down. Earnings season begins in a few weeks. A positive earnings season could trigger a year-end rally. The odds favor more selling until then. Of course, disappointing earnings would likely see the stock market fall further.
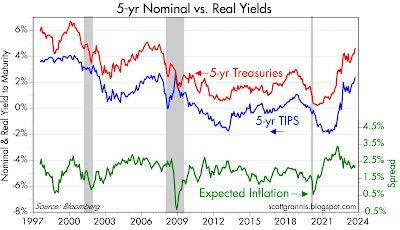
Bonds continue to struggle. The iShares 20+ Treasury Bond (TLT) has lost 13.57% in the three months ending September 27th, according to Morningstar. The TLT is down 9.0% on the year. It looks as if long bonds are going to show losses for a third year in a row. The TLT lost 4.6% in 2021 and 31.24% in 2022. Long bond yields normally rise (and prices fall) when inflation rises. Currently, inflation is falling, pushing up real yields. Long bond yields also rise when economic activity is strong because demand for loanable funds increases. Third quarter GDP is expected to clock in at close to 5%. Then there is the crowding out effect of increased government borrowing. Interest rates rise when the government soaks up credit because the supply of loanable funds is reduced.
Economic activity eventually weakens regardless of the reasons for rising long-term interest rates. Consumers and businesses can’t borrow as much so can’t spend as much. The government can’t continue to spend as much either. The latest Congressional Budget Office (CBO) federal budget deficit estimate is $1.7 trillion for 2023. The U.S. economy is approaching $27 trillion. The 2023 deficit is estimated at around 6.3% of GDP, three times the growth rate of the economy. Debt can’t grow more quickly than GDP forever. It is an unsustainable trend and unsustainable trends always end.
There are other costs to heavy government borrowing besides debt servicing. The supply of loanable funds is reduced when governments run deficits. Reducing the supply of anything without reducing demand leads to higher prices. Interest is the price of money. Higher interest rates are the result of increased government borrowing, all else equal. Private borrowing gets crowded out. And it is private borrowing that generates the economic activity that creates additional wealth for a nation. Governments do not create wealth. Private enterprise creates wealth.
The federal deficit hasn’t risen so fast when the economy was strong in at least the last 50 years, according to AlpineMacro. The independent global investment research firm calculates that the U.S. deficit increased by over $900 billion in the past 12 months. That's an increase of 3.4% of GDP while the economy was at full employment. Federal spending increased by $934 billion. That is a rate of growth not matched except during recessions or the Vietnam War, according to AlpineMacro.
BofA economist Claudio Irigoyen is projecting the deficit to rise to 7.5% of GDP with about 2.5% due to interest expense. Interest expense will total around 15% of federal revenues if Irigoyen’s estimate is correct. It seems obvious that the federal government needs to curtail spending. Reducing fiscal spending means slower GDP growth, all else equal. Higher interest rates mean less consumer and business spending as well. High government spending along with leftover Covid savings may have delayed a recession. It’s likely that a recession hasn’t been avoided altogether though. An early warning of impending trouble might be rapidly widening credit spreads. Credit Spreads widened from a low of 3.77% on 20 September to 4.09% on 28 September. Spreads aren't at levels that signal an impending recession yet.
But widening credit spreads are an early warning of economic distress among non-investment grade companies. Some 40% of Rusell 2000 (small cap) companies don’t make a profit. The Russell 2000 is down 10.8% since the beginning of August. Perhaps credit spreads and the Russell 2000 are signaling that the economy is weakening finally.
Economic Indicators
The Atlanta Fed GDPNow tool forecasts 4.9% growth for Q3 GDP as of 29 September. The GDPNow tool has proved accurate within 30 days of the release of the GDP number. The advanced estimate for third quarter GDP is due on 26 October. The Fed is expected to hold the funds rate steady in November. Futures are estimating an 81.7% probability it will keep the rate at 5.25%-5.50%. The probability of no change through year-end is 64.8%.
Higher rates are impacting the housing market. New home sales came to 675,000 in August, down from 739,000 the prior month. New home sales were also below expectations of 695,000. Pending home sales fell 7.1% in August after rising 0.9% the prior month. The number came in below the -1.0% forecast. Meanwhile, core PCE rose 0.1% in August down from 0.2% in July. Core PCE year-over-year fell to 3.9% from 4.3%. the inflation numbers combined with the fed funds futures makes it likely that the Federal Reserve is done hiking the funds rate
Buy Businesses Not Stocks
Stocks have performed poorly since early 2022. The Russell 2000 small cap index is down over 27% since it hit an all-time high November 8th, 2021. The S&P 500 is down 11% since its all-time high set on January 4th, 2022. The Nasdaq is down 12.2% since its all-time high set on November 22, 2021. We wrote about the sideways stock market last week but thought we’d mention it again. Clients are increasingly concerned about the lack of gains in their portfolios.
Warren Buffet once said that investors should keep their eyes on the playing field, not the scoreboard. He was talking about focusing on what you own rather than on your recent returns. We wrote last week that the range-bound stock market was not at all unexpected or uncommon. Prices got ahead of earnings after three double-digit return years. 2019, 2020, and 2021 saw big gains in stocks. Vanguard’s S&P 500 ETF (VOO) returned 31.35% in 2019, 18.29% in 2020, and 28.78% in 2021. It lost 18.19% last year but is up 13.10% this year. The equal weight S&P (RSP) is up 1.69% year-to-date. It didn’t lose as much last year as the S&P, dropping 11.62%. The iShares Russell 1000 Value ETF was down 7.74% last year and is up 1.71% YTD. Investors need to remain patient. Stock returns are volatile. Big years are often followed by periods of scant returns.
We may have another year or two of poor returns. We may not. Much will depend on whether S&P 500 earnings growth meets expectations. The index is trading at 18.4x 12-month forward earnings, still expensive. Earnings need to grow double digits to justify the valuation. Importantly, the average stock in the index is trading for a more normal 16x earnings. It is the mega-cap tech stocks that are pulling the valuation higher in other words.
Another Buffet saying: buy businesses not stocks. Norwood Economics is doing just that. Buying good companies on sale doesn’t guarantee above-market returns every year. It does greatly increase the odds of earning an acceptable risk-adjusted return over longer periods of time. Buy businesses not stocks. Focus on the playing field, not the scoreboard. Be patient. Words to live by when investing in the stock market.
Regards,
Christopher R Norwood, CFA
Chief Market Strategist