

Recession in 2024 Likely

Market Update
The S&P 500 slipped 0.16% last week to close at 4,450.32. The Dow and Nasdaq also barely moved. The Dow climbed 0.12%. The Nasdaq fell 0.39%. The S&P is down 5.6% since its all-time high of 4818.62 reached on 4 January of 2022. The S&P is up 18% in 2023 but lost 18.2% in 2022. Friday’s close was just above the 20-day moving average. The 20-day is still below the 50-day moving average, indicating ongoing short-term weakness.
It’s possible the S&P is putting in a top. A breach of 4,335.31 would open the door for a drop to the 200-day moving average at 4,195. The next few weeks are critical for the S&P’s medium-term direction. A move above 4,541.25 (the 1 Sept. high) increases the odds of another 52-week high before year-end. The last 52-week high came on 27 July when the S&P reached 4,607.07. A move above 4,541.25 also signals that investors are expecting positive economic news in 2024. A drop below 4,335.31 signals the opposite.
The Fed meets this week. No rate hike is expected. The CME FedWatch tool shows a 98.0% probability of the Fed leaving the funds rate unchanged. The fed funds futures market is placing a 60.8% probability of the rate remaining at 5.25% - 5.50% through year-end. Moreover, the futures market is looking for four quarter-point cuts in 2024. Investors will be looking at the Fed’s updated Summary of Economic Projections (SEP) for clues. The Fed will update the SEP during this week’s meeting.
The June SEP report has the Fed hiking another quarter percentage point by year-end. The CME FedWatch Tool and the SEP are at odds. Investors are hoping the Fed brings the SEP in line with the futures market. Failure to do so could trigger more selling and a test of 4,335.31. Updating the SEP to align with the futures market (no hike) will likely cause the market to rally. It could push the S&P to a new 52-week high.
Investors will also get a look at the Fed’s thinking on next year’s monetary policy. The FOMC SEP shows a median projection for a full point cut by the end of 2024, to 4.6%. But there is a wide range of outcomes clustered around that “central tendency” ranging from 4.4% to 5.1%. Investors hope the Fed confirms its forecast of interest rate cuts in 2024 at this week's meeting. Confirmation could see the market rallying. A failure to confirm a continued expectation of rate cuts would likely cause the market to sell off.
John Ryding, chief economic advisor for Brean Capital is a former U.S. central bank employee. He also did a stint with the Bank of England. He believes expecting four quarter-point interest rate cuts next year “might be a bit much”. The U.S. economy has exceeded expectations since the June SEP report. The Atlanta Fed’s GDPNow model is estimating 4.9% GDP growth for Q3. That is far above what was expected for the economy by the Fed back in June.
Meanwhile, the Fed’s SEP has core PCE falling to 2.6% by year-end 2024. It’s true that a drop in inflation to 2.6% would lead to a rise in the real-fed funds rate if the Fed doesn’t cut. (The real fed funds rate is the stated rate minus inflation). Holding the fed funds rate at 5.25% while core PCE falls to 2.6% would tighten monetary policy. The real fed funds rate would rise to around 2.6%. The neutral fed funds rate is the rate that neither stimulates or retards the economy. Economists think the neutral rate is around 0.5%.
It is unlikely that the U.S. economy can continue to grow above trend while inflation continues to fall. Above-trend growth (anything above about 2%) should put upward pressure on inflation. It’s basic macroeconomics. An economy can’t exceed its sustainable production capacity for long without the general price level rising as scarce resources are bid up in price. Think labor and wage growth. It thus seems unlikely that core PCE will drop to 2.6% by year-end 2024 if the economy continues to grow above trend.
It's more likely that the economy contracts in 2024. The amount of monetary tightening has been large. Debt is high. Consumers are running out of excess savings. The fiscal spending binge is coming to an end. A recession in 2024 remains the most likely economic scenario. There are too many economic signals pointing to recession to ignore.
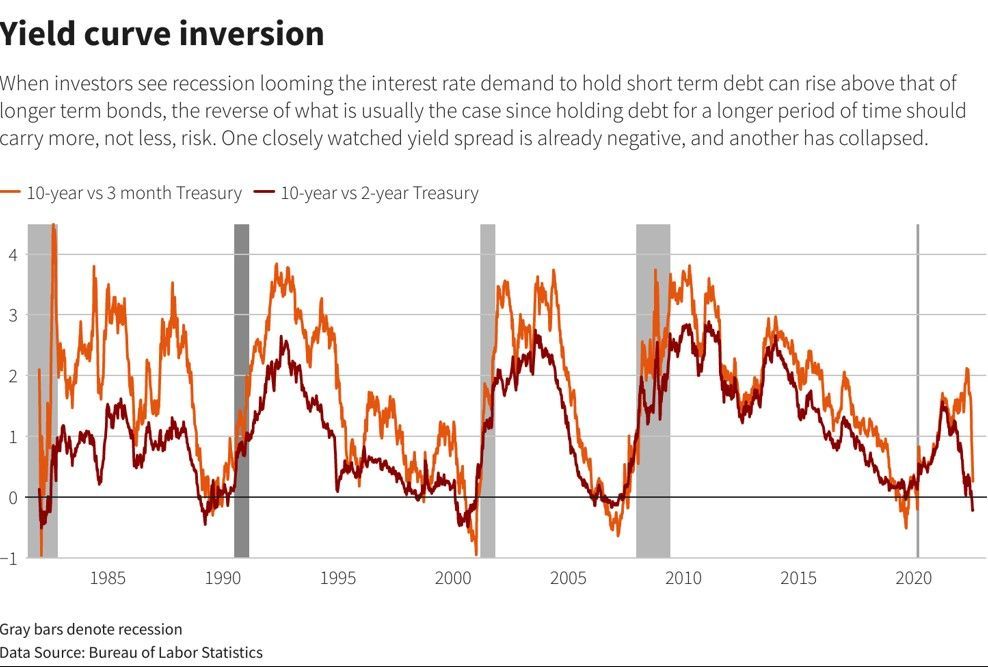
Federal tax receipts through July 31st are down 13% year-over-year. Federal tax revenues have fallen only eight times since 1960 on a y/y basis. Only once have they declined by 7% or more and that was in 2008/2009. The Leading Economic Indicators have declined 16 months in a row. The yield curve has been inverted since July of last year. The monthly NFIB Small Business Optimism index hovers above 90. The index has been that low only five times since 1975. Recession followed each time. The Census Bureau’s annual report on income, poverty and health insurance coverage reports that U.S. inflation-adjusted household income fell in 2022 by the most in 12 years. Manufacturing has been in contraction for almost a year according to PMI readings. Credit card debt has risen and now exceeds $1 trillion. There’s more but you get the idea.
The most likely course for the economy over the next 12 months remains recession. The most likely course for the stock market remains sideways to down over the next 12 to 18 months. Uncertainty remains high and risk management remains a priority.
Economic Indicators
The NFIB optimism index is an index tracking small business sentiment. It fell to 91.3 in August from 91.9. It is the 20th consecutive month in a row below the 49-year average of 98. Twenty-three percent of small business owners report inflation as their most important problem. That’s up 2% from last month. Small business owners expecting better conditions over the next six months fell by 7%.
Core CPI was worse than expected. It rose by 0.3% in August, ahead of the 0.2% estimate and the 0.2% previous month’s reading. Headline CPI rose year-over-year from 3.2% to 3.7%. Core CPI year-over-year fell to 4.3% from 4.7%. Producer prices rose 0.7% in August from 0.3%. The reading was above expectations of a 0.4% increase. Core PPI rose 0.4%, twice as fast as expected. PPI leads CPI. The Fed is unlikely to cut rates next year unless core PCE falls below 3%.
Retail sales came in stronger than expected. U.S. retail sales rose 0.6% in August. Sales were expected to rise 0.1%. Higher rates for longer seems like a high-probability scenario. Higher rates for longer will act as a drag on the economy and corporate earnings. Forecasts of a 12% increase in S&P 500 earnings next year seem optimistic.
Risk Management
Howard Marks of Oaktree Capital is widely regarded as one of the most successful investors in American history. His most recent memo to clients is titled, “Fewer Losers, Or More Winners?”. It’s about risk management. Risk is something we talk about with clients often. Most investors don’t appreciate the risks they take. They don’t understand that risk is an important feature of investing. Oh sure, they pay lip service to risk when asked how they feel about it. But then they pile on risk regardless while chasing returns in risky assets. All too often they panic when the risk surfaces and torpedoes an investment. I often refer to risk as the silent killer (of retirements).
Marks starts his memo by retelling a story from his early years. He was having dinner with the head of the General Mills pension fund. The fund manager had served as the chief investment officer for the pension for 14 years. In that time the fund had never ranked above the 27th percentile in returns. It had also never finished below the 47th percentile. The punch line was that the “steady Eddy” fund finished in the 4th percentile for the entire 14-year period.
Marks adds that around that same time a prominent value investing firm reported terrible results. The president of the firm was quoted as saying, “If you want to be in the top 5% you have to be willing to be in the bottom 5% too.”
Norwood Economics believes in avoiding big losses even if it means missing out on big gains. The math works better that way. Lose 50% and you need to earn 100% to get back to break even. That can take a long time. Our clients broke even last year plus or minus a few percent. The S&P 500 lost 18.2%. The Nasdaq lost 32%. They are both still down from the start of 2022. We agree with Howard
Marks who advocates risk control to avoid extreme results. He writes in his memo that controlling risk is:
- Less likely to produce extreme volatility,
- Less likely to produce huge losses which can't be recouped and, most importantly,
- More likely to work (given the fact that we are only human).
Marks concludes that the General Mills track record taught him an important lesson. Focus on avoiding losers and losing years, and the winners will take care of themselves. Norwood Economics agrees.
Regards,
Christopher R Norwood, CFA
Chief Market Strategist


