The market is way ahead of itself
Market Update
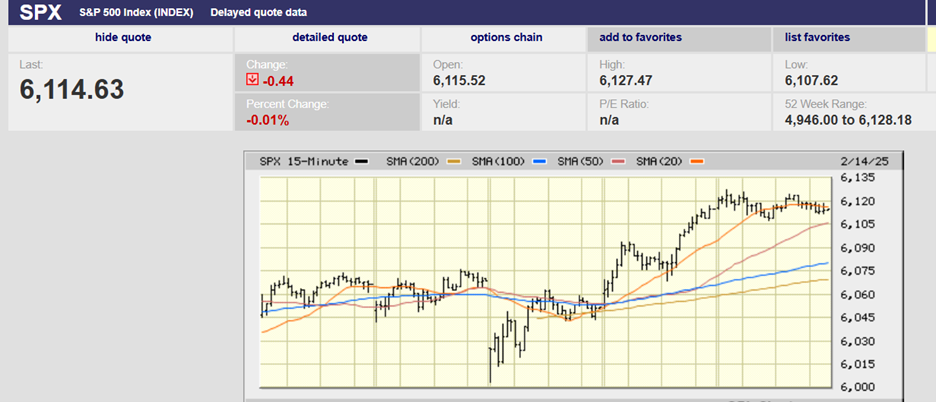
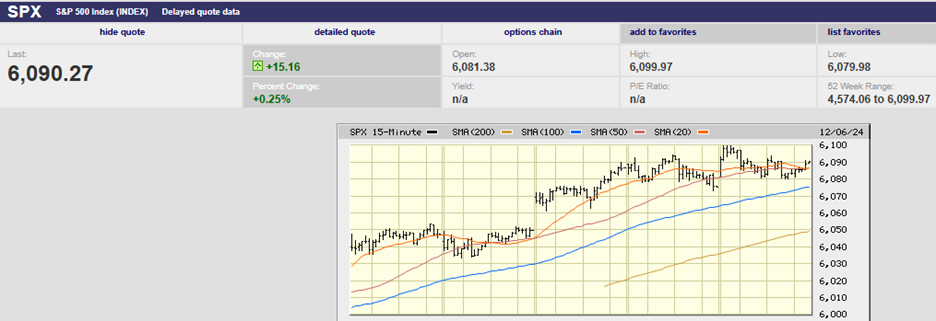
The S&P 500 lost 1.3% last week to finish at 4457.49. The index is up 16% in 2023 but lost 18.2% last year. It is down 7.5% since its all-time high on 4 January 2022. The Nasdaq fell 1.9% last week. It is up big this year, was down big last year, and is still 8.9% below its all-time high set on 22 November 2021. The S&P hasn’t gone anywhere in 21 months. The Nasdaq has traded sideways for almost two years. Price determines return over the long run. Stocks were expensive in November 2021, and are still expensive today.
The S&P 500 has returned 4.6% per year excluding dividends since 1871. It has returned 9.1% per year including dividends during that period. (It is noteworthy that dividends accounted for almost half the total return). The S&P has returned 6.8% per year including dividends and adjusted for inflation. The S&P 500 has returned 8.48% per year from 1928 through 2021.
The U.S. economy averaged between 3.0%-3.5% real growth over the last 100 years or so. Inflation has averaged around 3.5% since WWII. Nominal economic growth of between 6%-7% has produced about the same earnings growth. Profit margins have been stable and are mean reverting. Jeremy Grantham of GMO fame says “profit margins are probably the most mean-reverting series in finance.”
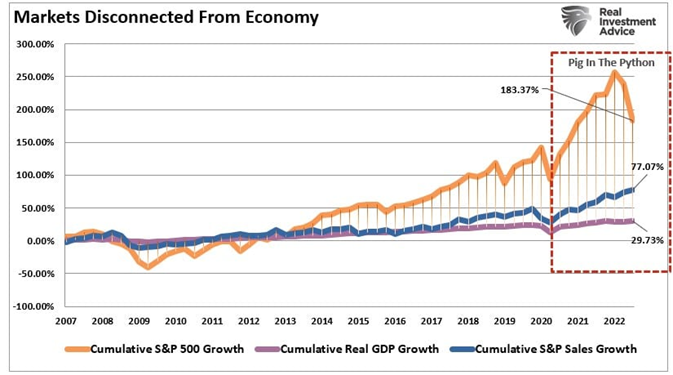
Stocks are expensive because returns have outstripped economic growth over the last decade. That also means returns have outstripped earnings growth. The S&P returned 13.82% from 2009 to 2021. It returned 15.57% from 2017 through 2021. Returns were well above the long-term average for both periods. Earnings didn’t keep up and the price-to-earnings ratio expanded. The S&P is trading at 19.1x the next four quarters’ earnings. The long-run average is around 15.5x. The S&P 500 hasn’t gone anywhere in 21 months. Earnings need to catch up to price. The next few years will likely see more stagnation. Again, price determines returns and the stock market is still expensive.
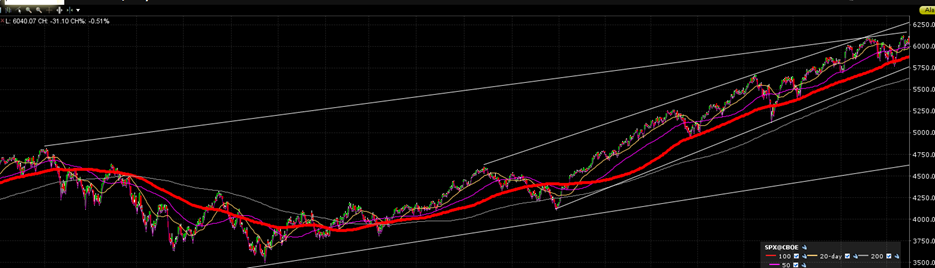
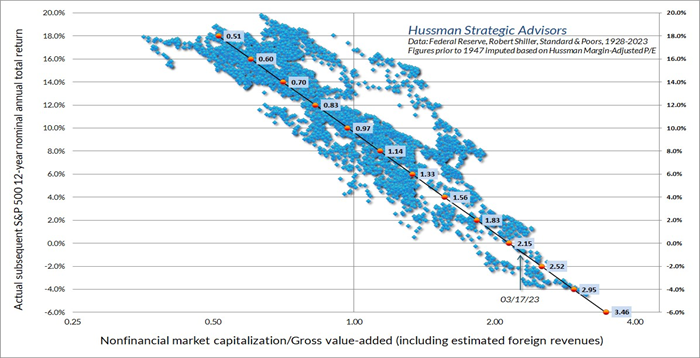
The chart below shows an expected 12-year return of around negative 1 percent annually. The return forecast is based on market capitalization divided by gross value added. Gross value added is approximately equal to gross domestic product. In other words, returns are highly correlated to the price paid for the stock market relative to the size of the economy.
Yet some folks hope…
FactSet expects earnings to grow 12% next year to $248 per S&P 500 share. It sees sales growth accelerating and profit margins rising. Profit margins were the widest in 50 years in 2022. They have declined in 2023, falling from 12.2% a year ago to 11.1% in Q2 2023. A net profit margin of 11.1% isn't all that bad. Yet analysts believe margins will begin to expand back toward 50-year highs in 2024. Reasons vary but don't seem that compelling. Certainly, rising net profit margins in 2024 anticipate economic growth rather than recession.
FactSet predicts earnings growth of 12.3% in 2025 following 2024’s double-digit growth. Analysts clearly don't see falling inflation impacting revenue growth in 2024 or 2025. Nor do they believe profit margins will suffer. Mike Wilson of Morgan Stanley has a different point of view. “Falling inflation ... is a potential headwind to earnings growth,” according to Morgan Stanley's Mike Wilson. “It will mean less pricing power and tighter profit margins for more companies," he writes.
Barron’s writes that FactSet’s earnings forecast of $248 per share could get the S&P 500 to 4,910 before year-end. That would mean investors are willing to pay 19.8x 12-month forward earnings. A 20x P/E is 30% above the long-term average. Seems like a stretch with two-year Treasuries fetching over 5%.
In fact, the market is already the most expensive relative to Treasuries in 21 years, according to Leuthold Group. Or at least that's what the Fed-Model shows. The Fed model compares the earnings yield of the S&P with the 10-year Treasury yield. Doug Ramsey of Leuthold calculates that the 10-year Treasury yield is 0.79 times the S&P earnings yield. He says it is more than double the 0.37-times average of the “free money” years of 2009-21.
Price determines return over the long run. The S&P is expensive based on half a dozen different reliable metrics. We may not have a bear market anytime soon. Or we might be in a bear market now. Regardless, it is likely that the S&P 500 annual return for the foreseeable future will be below average. Financial planners should not be plugging 9% into their financial planning software. Clients' spending goals are likely to go unmet if they do.
Economic Indicators
It was a light week for economic data. Wednesday’s ISM services index stood out for its strength. The August 54.5% reading was stronger than expected. It also easily beat the prior month’s 52.7% number. It was the eighth straight monthly gain. It is at the highest level since February. U.S. productivity was revised down to 3.5% for Q2 from 3.7%. Unit-labor costs were revised to 2.2% for Q2, up from 1.6%. The reduction in productivity and increase in unit labor costs are negative. Real GDP is the sum of productivity gains and the increase in the labor force. Unit labor costs impact inflation. Initial jobless claims remained low at 216,000, down from 229,000.
The CPI report comes out Wednesday this week. The PPI numbers are out Thursday. The reports have market-moving potential.
Short Term Noise
Investors struggle to remain patient when investing. They want to make changes when their portfolio is falling. It’s hard to stand by and watch your hard-earned savings melt away. Investors forget, or never understood, that short-term performance is all noise. Stocks go up and down in a random walk. Burton Malkiel gets credit for pointing out that no one can predict short-term stock price movements. Or at least that is what the data shows. He published the iconic “A Random Walk Down Wall Street” in 1973. It is still in print with a 13th edition coming out in 2023.
Random Walk theory claims that asset prices move randomly. It follows then that past prices can’t be used to predict future prices. It also follows that the stock market is efficient, reflecting all available information. Random Walk Theory is the basis for index investing. There is a weak and strong form of the Efficient Market Hypothesis. But I’ll spare you the details.
The short version is that other researchers have shown that short-term stock price movements aren't completely random. Momentum does exist in the market for instance. But Malkiel's main insight has held. Investors do a terrible job predicting short-term stock price movements. Prices do move randomly in the short run. The long run is a different matter. Noise might drive price movements over one-, three-, and five-year periods, but fundamentals drive stock prices over the long run.
Rising interest rates are the standout feature of 2022 and 2023. Rates are still rising with money markets now yielding 5.3% or more. Short-term Treasury bond ETFs have SEC yields of better than 5% as well. Stocks have competition. Some types of stocks are hit harder than others in a rising interest rate environment.
Norwood Economics has heavy exposure to dividend-paying stocks. Our stock portfolio held up well in 2022. It was up a few percent, depending on the client, while the S&P 500 was down 18.2% and the Nasdaq down 32%. Growth stocks were crushed last year as investors fled due to rising interest rates. Growth stocks are more sensitive to interest rates because the present value of future earnings declines as interest rates rise. The Norwood Economics’ portfolio has trailed behind the mega-cap growth stock-dominated S&P in 2023. The S&P is up 16% YTD.
The index has benefited from the performance of the so-called Magnificent Seven. (Tesla, Nvidia, Apple, Amazon, Microsoft, Meta, and Alphabet.) Those seven stocks accounted for 71.5% of the S&P gains year-to-date as of 31 August, according to S&P Dow Jones Indices. Wide swings in growth stock prices over the last 19 months are short-term noise. Volatile interest rates have been the catalyst and that volatility will subside.
The equal-weighted ProShares S&P 500 Dividend Aristocrats (NOBL) ETF has returned around 5% year-to-date. The return includes dividends. “WE have seen this big rotation into tech and growth stocks,” wrote Keith Lerner, co-chief investment officer for Truist Advisory Services.
Lerner pointed out that consumer staples make up 24% of the NOBL ETF. Consumer staples stocks are down about 3% on average. Why? Higher interest rates make bonds more competitive for investors seeking income. Lerner also points to weakness in “parts of healthcare and utilities – the so-called bond proxies.” The healthcare sector has returned about minus 2%, and utilities are off by about 11% year to date. Stocks moving opposite of interest rate changes is short-term noise.
Successful investors focus on business fundamentals. They focus on the earnings yield and expected earnings growth. Those are the two metrics that determine long-term stock performance. A stock’s long-run return is the sum of the earnings yield and earnings growth. The third component of return comes from changes in the P/E ratio. Buying stocks with low P/Es increases the chance of multiple expansion. It decreases the chance of contraction. Buying stocks with a high earnings yield and some earnings growth leads to outperformance over the long run. It is more certain than swinging for the fences with high price-to-earnings stocks.
The Norwood Economic portfolio has been under pressure since April of 2022. The reasons though are all short term. Patience is a prerequisite to successful investing. Yet it is so very hard for us to practice.
Regards,
Christopher R Norwood, CFA
Chief Market Strategist