No Rate Cuts in Sight
Market Update
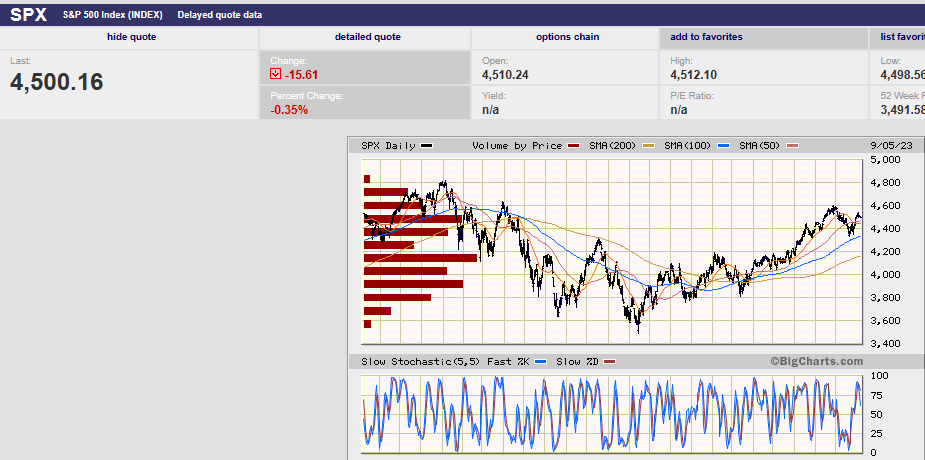
The S&P 500 climbed 2.50% last week to finish at 4515.77. The index is up 17% year-to-date. It lost over 19% last year. It is down 6.3% since its 4 January 2022 all-time high. The Nasdaq rose 3.25% last week and is up more than 30% year-to-date. It lost 32% last year and is down 7.5% since its November 2021 all-time high. The two-year Treasury bond is yielding 4.87% as of Friday. The 10-year Treasury yield was 4.18% as of Thursday.
The 10-year Treasury inflation-protected bond (TIPS) yield is 2%, the highest in 15 years. The real yield is the nominal yield minus inflation. The real yield is the real cost of money. The real cost of money has been lower than normal since the Great Recession. A higher cost of money will reduce borrowing and hurt profit margins all else equal.
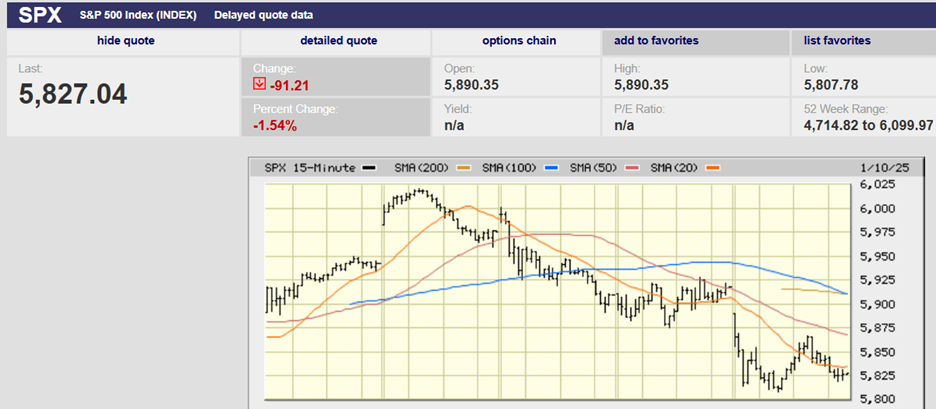
We wrote last week that first support for the S&P 500 was around 4,300. The index didn’t test support last week. It traded as low as 4,414.98 on Monday in a sideways session. Tuesday saw a surge in buying in response to a lower job openings report. Investors pushed the index above the 50-day and 20-day moving averages. Job openings fell to a 28-month low. They stood at 8.8 million in July, down from 9.2 million.
The S&P has fallen almost 6% since hitting a 52-week high on 27 July. It bottomed out at 4,335.31 on 18 August before starting to bounce. The index is neither oversold nor overbought. That said, the S&P is likely to trade down in the next few weeks. The 50-day is at 4,470. The 20-day is at 4,450. A break of those moving averages would pave the way for a test of the recent lows at 4,356.29 and 4,335.31.
The Atlanta Fed’s GDPNow forecast is 5.6% as of 1 September. The probability of the Fed holding the fed funds rate steady in September has risen to 94.0%. The CME FedWatch tool has the probability of the rate remaining steady in November at 64.6%. The probability is 61.9% for the December meeting. The futures market is increasingly pricing in a Fed cut at either the March or May meeting in 2024.
The unemployment rate did rise to 3.8% last week from 3.5%. That still puts it well under the Fed’s estimate of the natural rate of unemployment. Richard K. Crump of the Federal Reserve Bank of New York and co-authors estimate that the natural rate of unemployment is around 5%. The natural rate of unemployment is the rate that is consistent with full employment and stable inflation.
Federal Reserve rate cuts are unlikely with the economy growing and unemployment below the natural rate of unemployment. It is even less likely to cut given that inflation is still well above the Fed’s stated target of 2%. The core PCE index rose to 4.2% year-over-year from 4.1% in the latest reading released last week.
“The Fed can’t cut rates as aggressively as it has, given the inflation problem,” says Mike Wilson, chief U.S. equity strategist at Morgan Stanley. “On the fiscal side, it is already unprecedented to have a federal deficit of 8% [of GDP] when the unemployment rate is at 3.5%.” Cutting rates adds monetary stimulus to the existing fiscal stimulus. Monetary stimulus risks reigniting inflation, something the Fed wants to avoid at all costs. The Fed typically waits until there are signs of recession before beginning to cut.
“Falling inflation might be good for bond prices and stock market multiples, but it is a potential headwind to earnings growth,” Morgan Stanley’s Wilson says. “It will mean less pricing power and tighter profit margins for more companies”. Wilson is forecasting S&P 500 earnings of $185 this year. His forecast is well below industry analysts’ consensus estimate of $220.
The stock market is vulnerable to more selling as earnings estimates fall. The Q4 2023 estimate is for a rise of 9.1% in earnings. The consensus is for earnings growth of 11.8% in 2024 and 12.6% in 2025. Those numbers seem unlikely given the amount of monetary tightening in the pipeline. They seem even less likely given the government’s growing need to curb large budget deficits. Restrictive fiscal policy along with tighter monetary policy will impact the economy.
Uncertainty remains higher than normal. Risk management remains paramount.
Economic Indicators
The job openings report lit a fire under the stock market last week. Tuesday’s jobs report showed the number of job openings falling to 8.8 million from 9.2 million. Expectations were for 9.5 million openings. Job openings fell to a two-year plus low, and over the past three months by the most on record. The job quits rate fell to the lowest level since January 2021 as well. Employers are advertising fewer job openings. Employees are increasingly reluctant to leave their jobs. Taken together the two reports signal a weakening labor market. Also, hires have declined by 458,000 over the last two months, according to Danielle Park, CFA. It is the lowest level since January 2021. It is the largest decrease in hires since the end of 2020.
Meanwhile, U.S. government data on Friday showed a larger-than-expected gain of 187,000 nonfarm payrolls in August. But there were significant downward revisions for the previous two months. The downward revisions totaled 110,000 fewer jobs. The three-month average job increase is almost 150,000. The unemployment rate jumped to 3.8% from 3.5%. It rose because of a 0.2% increase in the labor-force participation rate rather than a loss of jobs. It was the first increase since March. The monthly gain in average hourly earnings slowed, but average hours worked rose.
All told there are some early signs that the jobs market is weakening. The quits rate in particular is worth watching as it is a leading indicator. “The quits rate tends to be a forward-looking measure of labor market pressures and tends to lead wage and salary growth,” according to Michael Darda of Roth MKM. Darda is Roth’s chief economist and strategist.
The Federal Reserve may be done tightening if inflation continues to fall, and the labor market soften. Core PCE came in as expected at 0.2% for July. The year-over-year number ticked up to 4.2% from 4.1%. The increase was more about base effects than a real reversal in the inflation trend. Or at least that is how pundits are spinning it. The base effect relates to inflation in the corresponding period of the previous year. A low inflation rate last year means even a small increase this year gives a higher rate of inflation. And that is exactly what happened in July.
Just because the Fed may be done hiking doesn’t mean rate cuts are near. The longest Fed pause between the last rate hike and the first cut was 15 months (July 2006 to September 2007). The average between the last hike and first cut was eight months. In every case since 1969, recessions began at or shortly after the first rate cut, according to Park. The stock market bottomed 13 to 33 months after the last Fed hike. Assuming the July hike is the last, the stock market won’t bottom until at least next August if history is any guide.
Intrinsic Value and Art
Warren Buffet will tell you that gold isn’t an investment because it generates no cash flow. It has no intrinsic value. Investments must generate cash flow to the owner to have intrinsic value. Stocks are part ownership in businesses. Owning a stock means getting a share of the business profits. The profits can be paid out as dividends. Profits also can be used to pay down debt, buy back shares of the company, or reinvested in growth. Buffett considers investments that don’t produce cash flow speculations.
Art has no intrinsic value since it produces no cash flow. Art, gold, and limited-edition cars are all things that are only worth what the next person is willing to pay for them. Some speculations such as gold have held their value over long periods of time. Tulip bulbs did not.
The Tulip Bulb mania of the 1600s saw Dutch merchants paying more than the value of their houses for a single tulip bulb. Tulip bulbs don’t last of course and neither did the Tulip Bulb mania. The speculative episode took place during the Dutch Golden Age. It was a period of economic prosperity that fueled speculative investment. The Tulip Mania was a symptom of too much liquidity in the Dutch economy.
Other speculations have done quite well. Some art for instance has continued to appreciate in value for hundreds of years. Much art never catches the fancy of collectors though. And people are fickle, which means sometimes some art goes out of fashion, failing to stand the test of time. Art, cars, and Willie Mays rookie cards can go in and out of favor. However, art in general has served as a good store of value over the years. Specific pieces are less certain.
Art isn’t correlated to any stock indexes according to numerous auction houses. Or as one auction house puts it, “Artwork is not correlated to any stock index or market. Buying art acts as a store of value separate from traditional asset movements.”
There is a place for alternative investments in high-net worth portfolios. Low or negative correlation is the goal. An increase in risk-adjusted return the reward. But speculations are by their very nature riskier because they don’t generate cash for the owner. Tastes change. Easy financial conditions send prices higher. Tighter financial conditions cause prices to drop.
Currently, there is high liquidity in the U.S. economy. The money supply exploded during the Covid rescue. M2 is still more than a trillion above trendline growth. Excess money sloshing around in the economy pushes speculative investments higher. Draining excess liquidity from the economy can trigger lower prices. Fads can also push some alternative investments higher for short periods. Price discipline is important when buying alternative investments. It is no different than when buying stocks.
Regards,
Christopher R Norwood, CFA
Chief Market Strategist