From the Bleachers, Vol. 1
January 10, 2019
Old Century People — Fishers, IN — Norwood Economics

From the Bleachers Vol. 1

Far from a certainty, but more likely than not, we’ll see some retracement towards the recent low in the coming weeks.

The market lost 20.2% from its all-time high in late September to its 52-week low in late December. It has since bounced 248 points, or about 10.5% from the low. There’s a pretty good chance the market will fall again, perhaps reaching, or even breaking, the prior low at 2346.58, as people who did not sell the first time around decide to lighten up on stocks in January. Far from a certainty, but more likely than not, we’ll see some retracement towards the recent low in the coming weeks. 


Regardless, we are still in a high-risk environment with a recession out there in our future. Our forecast remains the same: a likely recession starting in the second half of 2019, or first half of 2020. There is a possibility of the next recession not appearing until late 2020, or early 2021 if the Federal Reserve stops raising the Federal Funds rate, or if they decide to reduce or abandon Quantitative Tightening (QT). The Federal Reserve is currently shrinking its balance sheet by $50 billion monthly, $600 billion annually. The economy is approximately $20.5 trillion and the Federal Reserve’s balance sheet was around $4.5 Trillion before it began QT. A $600 billion annual shrinkage equates to more than 13% annually based on the Fed’s balance sheet at the start of QT, and also to approximately 3% of GDP. The Federal Reserve has never tried Quantitative Easing (QE) or QT before, so it’s uncertain what impact QT will have on the real economy.


What to do, what to do?


Capital preservation is the name of the game if the next downcycle will impact your spending plans in retirement. Maintain your strategic (long-term) asset allocation otherwise. Buy good companies as they go on sale in both cases.


Exxon Mobile (XOM - $71.73)


We bought Exxon Mobile for clients a few weeks ago at $75 per share. XOM was caught up in the market sell-off and bottomed in late December at $64.65 before recovering to its current price. Fair value is approximately $97 per share. The company pays a dividend of $3.23 per share for a current yield of 4.5%. Our clients’ yield is 4.3% at purchase price. XOM was $104.80 in 2014 and $95.6 in 2016. XOM’s 2018 high was $89.3. A recession during the next couple of years may delay our returns in the stock, but we think it likely XOM will see $100 per share in the next three to four years. Even if it takes four years, our investors will earn approximately 50% on their investment for an annual return of 12.5% per annum, ahead of the 9% to 10% long-run S&P 500 return. Should XOM see $100 within three years, the total annual return jumps to almost 17% per annum.


WARNING: We are not making a recommendation. We are only disclosing one of the stocks we’ve recently bought for clients, and providing some information as to why we made the purchase.


Regards,


Christopher R. Norwood, CFA


Chief Investment Officer
By Christopher Norwood November 17, 2025
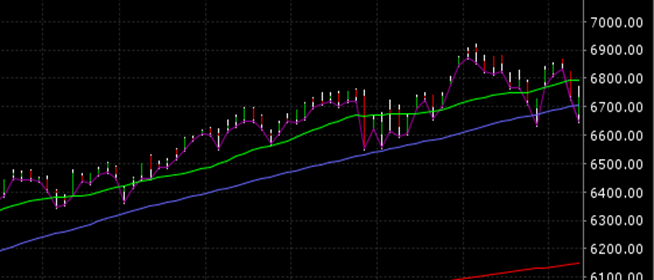
Executive Summary The S&P 500 was flat last week The U.S. government is once again open for business Markets thrive when liquidity rises GDP grows faster when the government spends more The odds that the Fed will cut a quarter-point on December 10th fell to 45.8% The S&P 500 is a concentrated index, heavily weighted toward technology Diversification reduces risk without necessarily reducing return Deciding when to take Social Security is about maximizing your benefit (A quick note this week due to travel on my part. You’ll find a variety of comments about last week’s market and events that may impact the stock and bond markets. Also, some thoughts on conversations with clients.) The S&P 500 was flat last week and is testing its 50-day moving average again (purple line below). We may see a down week this week. A fall below November 7th’s low of 6631.44 would likely lead to a further drop. A lower high and lower low would be in place, the definition of a down trend.
By Christopher Norwood November 10, 2025
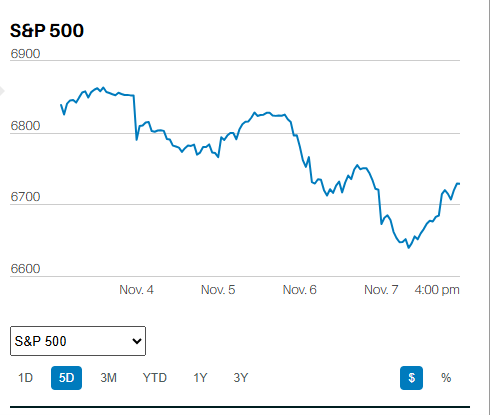
Executive Summary The S&P 500 fell 1.6% last week to close at 6,728.8 There was a widespread sell-off in the Tech space The Nasdaq Composite had its worst week since the week ending April 4th The jobs market is a concern for the Federal Reserve Data is scarce, but the jobs market seems steady U.S. services sector economic activity picked up in October A diversified portfolio is more important for risk management than ever The S&P 500 fell 1.6% last week to close at 6,728.8. The Nasdaq 100 fell 3.1% on the week. The declines were blamed on a report released Thursday by Challenger, Gray & Christmas, according to Barron’s. But the market fell throughout the week. The Challenger Gray report wasn't released until Thursday. The report may have helped sink the market last week, but it wasn't the lone catalyst.
By Christopher Norwood November 3, 2025
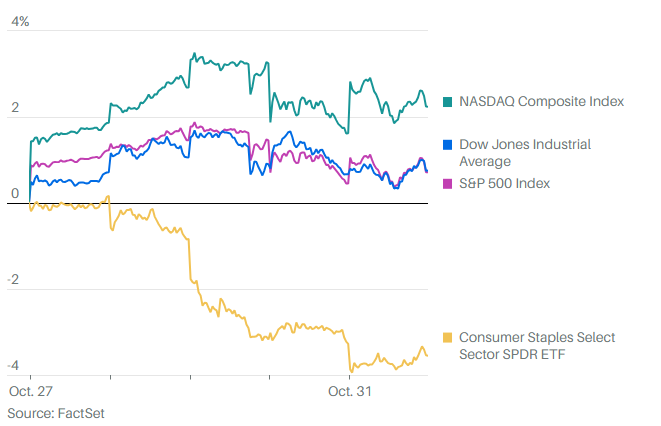
Executive Summary The S&P 500 rose 0.7% last week to finish at 6,840.20 The S&P is up 16.3% year-to-date A stock represents ownership in a business The S&P 500 is rising at an increasing rate, and that can't go on forever Profit margins have been stable over the long run The Federal Reserve cut the Fed funds rate by one quarter point last Wednesday, but why? Inflation appears nowhere near declining to the Fed’s 2% target The annualized headline CPI September number was the second-highest since January Inflation is hurting the lowest 50% of income earners in the U.S.
By Christopher Norwood October 27, 2025
Executive Summary The S&P 500 rose 1.9% last week The Fed will cut the Fed funds rate by 0.25% this week. The funds rate is currently 4.00% to 4.25%. Financial conditions are already easy The stock market is setting new highs Gold typically does best when liquidity is abundant Gold is up 54% YTD Bond investors seem to be signaling a recession ahead Stock investors see blue skies instead The Stock Market
By Christopher Norwood October 20, 2025
Executive Summary The S&P 500 rose 1.7% last week to finish at 6664.01 The Nasdaq & the Dow Jones rose as well last week We had an inside day last Monday, then an inside week Earnings season is here The four credit events might snowball into something more serious Credit spreads have started to react, widening over the last two weeks Bond yields fell (yields down, price up) last week The dollar index is also falling The Federal Reserve has been draining excess reserves from the system since 2022 It appears as if the Fed has no choice but to end its Quantitative Tightening (QT) program The Stock Market The S&P 500 rose 1.7% last week to finish at 6664.01. The Nasdaq 100 was up 2.4% and the Dow was up around 1.5%.
By Christopher Norwood October 13, 2025
Executive Summary The S&P 500, Nasdaq & the Dow Jones fell last week President Trump tanked the market Friday with a post about trade talk troubles with China The S&P 500 still has a lot of momentum, though Bond investors aren’t expecting a recession any time soon The Atlanta Fed GDPNow tool is estimating 3.8% real GDP growth for Q3 The AI boom is increasingly dependent on circular cash flows The U.S. stock market has a lot of exposure to AI The Stock Market
By Christopher Norwood October 6, 2025
Executive Summary The S&P 500 rose 1.1% to close the week at 6715.79 The Nasdaq was down 0.3% last week The Dow Jones Industrial Average was up 1.99%. The government shutdown materialized on Wednesday The Fed is expected to cut the funds rate by another quarter point in October Unemployment isn’t rising, and consumers are still spending Recession red flags The last 18 years have been unusual A recession is not Norwood Economics’ base case
By Christopher Norwood September 29, 2025
Executive Summary The S&P 500 fell 0.3% last week to finish at 6,643.66 The Dow, Nasdaq, and Tech sector ended lower as well The S&P average annual total return is 7.9% since the 2000 market peak The economy grew 3.8% in Q2 (third estimate), up from the prior 3.3% second estimate Financial conditions remain loose The 10-year Treasury yield has little room to fall from current levels The elderly and poor suffer most from the impacts of inflation Norwood Economics manages diversified portfolios This time is NOT different The S&P might see negative returns over the next decade Economic growth is the lowest in the past 25 years There are no piles of cash sitting on the sidelines The Stock Market
By Christopher Norwood September 22, 2025
Executive Summary The S&P 500 rose 1.2% last week to finish at 6,664.36 The S&P 500 is up 13.31% year-to-date The S&P is expensive The Fed updated its “Dot Plot” The 10-year yield rose last week despite the Fed’s rate cut The Fed is signaling at least two more rate cuts by year's end A pullback of 10% or so wouldn’t be unusual, but there’s no data signaling recession yet The top ten most expensive S&P 500 companies make up over 39% of the market cap UBS economists estimate a 93% chance that the US will slip into a recession this year Investors should review their portfolios before the next bear market The Stock Market
By Christopher Norwood September 15, 2025
Executive Summary The S&P 500 rose 1.6% last week to finish at 6,584.3 The stock market rises long-term due to earnings growth and interest rates A stock is ownership in a business Investors are willing to pay more for a dollar’s worth of earnings today than in the past Profit margins are already near record highs The Volatility Index (VIX) closed the week at 14.76 The market is setting new highs The CME FedWatch tool places the odds at 100% for a rate cut Wednesday The August jobs report and last week’s jobs revision are driving rate cut expectations Cutting the fed funds rate isn’t the answer to slower job growth Higher long-term rates will negate any benefit from a rate cut The Stock Market