From the Bleachers, Vol. 2
January 15, 2019
Old Century Men and Women in Market — Fishers, IN — Norwood Economics

Market Updates, Market Risks, and why Index Funds once again beat Actively Managed Funds in 2018

MARKET UPDATE

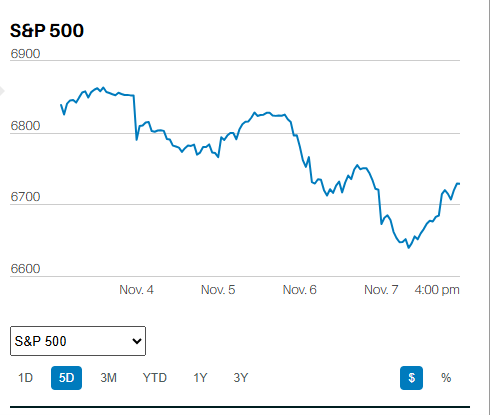
On the fifth day the market broke through 2600, finally, after bumping its head against that ceiling the prior four trading sessions. Why is a finish above 2600 important for short term market direction? Because traders care about those sorts of things when trying to gauge very short-term market movements. The short-term trend remains up - barely, while the intermediate and long-term trends remain down. Today the S&P 500 has continued higher in early trading touching the 50-day moving average at 2623. The market may push a bit higher from here, but we still see the rally off the late December lows as an oversold bounce with the likelihood of a retracement toward the 2346 low in the next few weeks remaining fairly high. 

MARKET RISKS

The corporate bond market is one area that might cause problems for capital markets as the business expansion comes to an end. Bond issuance has skyrocketed and credit standards have declined. There were about $700 billion in BBB rated investment grade bonds outstanding in 2008, according to Barron’s. The number has skyrocketed to approximately $3 trillion, fully half of the $6 trillion investment grade corporate bond market. Why does it matter? Triple B bonds are the lowest rung of the investment grade ladder. A recession, or even significant slowdown in the economy (expected), will reduce corporate cash flow and likely lead to downgrades by the major rating agencies. Many institutional investors aren’t allowed to own High Yield debt (junk) and would be forced to sell. Falling bond prices mean rising interest rates for companies already struggling (at that point) to service existing debt, including rolling over maturing debt. It gets worse:

“A Morgan Stanley research report suggests that, based on leverage ratios alone, 45% of investment-grade corporate bonds would be rated junk right now. The report further suggests that around 60% of corporate bonds currently rated BBB would be rated junk by the same leverage-ratio metric. That’s around $1 trillion of par value, or about 150% of the junk-bond market’s value,” according to Barron’s

INVESTING

Actively managed mutual funds continue to underperform index funds, something they’ve been doing for 50 years. The data is overwhelming; actively managed mutual funds don’t earn enough to compensate investors for the fees and expenses investors pay them. Importantly, the sad failure of actively managed funds is not equivalent to saying that an investor can’t beat the S&P 500 index. Buying good companies when they’re on sale is a tried and true means of beating the market. In fact, value investing outperforms over the long run, and by substantial margins - just not necessarily every year.


The annual S&P Indices versus Active (SPIVA) report is out for 2018. Once again, index funds trounced actively managed funds. Nearly 90% of large-cap stock fund managers underperformed the S&P 500 index in the past decade. Over the same 10-year period, 96% of mid-cap managers failed to beat the S&P 400 mid-cap index. Likewise, 80% of small-cap managers underperformed. 


Getting the asset allocation decision right is crucial to getting into a successful retirement. The mix of assets is the main determinant of future returns. Changing the asset mix to manage risk is appropriate when spending goals may be threatened by a falling stock market. Otherwise investors should focus on an asset allocation that will help them meet their spending goals in retirement, keep costs as low as possible, and leave others to invest in more expensive, underperforming, actively managed funds.

By Christopher Norwood November 3, 2025
Executive Summary The S&P 500 rose 0.7% last week to finish at 6,840.20 The S&P is up 16.3% year-to-date A stock represents ownership in a business The S&P 500 is rising at an increasing rate, and that can't go on forever Profit margins have been stable over the long run The Federal Reserve cut the Fed funds rate by one quarter point last Wednesday, but why? Inflation appears nowhere near declining to the Fed’s 2% target The annualized headline CPI September number was the second-highest since January Inflation is hurting the lowest 50% of income earners in the U.S.
By Christopher Norwood October 27, 2025
Executive Summary The S&P 500 rose 1.9% last week The Fed will cut the Fed funds rate by 0.25% this week. The funds rate is currently 4.00% to 4.25%. Financial conditions are already easy The stock market is setting new highs Gold typically does best when liquidity is abundant Gold is up 54% YTD Bond investors seem to be signaling a recession ahead Stock investors see blue skies instead The Stock Market
By Christopher Norwood October 20, 2025
Executive Summary The S&P 500 rose 1.7% last week to finish at 6664.01 The Nasdaq & the Dow Jones rose as well last week We had an inside day last Monday, then an inside week Earnings season is here The four credit events might snowball into something more serious Credit spreads have started to react, widening over the last two weeks Bond yields fell (yields down, price up) last week The dollar index is also falling The Federal Reserve has been draining excess reserves from the system since 2022 It appears as if the Fed has no choice but to end its Quantitative Tightening (QT) program The Stock Market The S&P 500 rose 1.7% last week to finish at 6664.01. The Nasdaq 100 was up 2.4% and the Dow was up around 1.5%.
By Christopher Norwood October 13, 2025
Executive Summary The S&P 500, Nasdaq & the Dow Jones fell last week President Trump tanked the market Friday with a post about trade talk troubles with China The S&P 500 still has a lot of momentum, though Bond investors aren’t expecting a recession any time soon The Atlanta Fed GDPNow tool is estimating 3.8% real GDP growth for Q3 The AI boom is increasingly dependent on circular cash flows The U.S. stock market has a lot of exposure to AI The Stock Market
By Christopher Norwood October 6, 2025
Executive Summary The S&P 500 rose 1.1% to close the week at 6715.79 The Nasdaq was down 0.3% last week The Dow Jones Industrial Average was up 1.99%. The government shutdown materialized on Wednesday The Fed is expected to cut the funds rate by another quarter point in October Unemployment isn’t rising, and consumers are still spending Recession red flags The last 18 years have been unusual A recession is not Norwood Economics’ base case
By Christopher Norwood September 29, 2025
Executive Summary The S&P 500 fell 0.3% last week to finish at 6,643.66 The Dow, Nasdaq, and Tech sector ended lower as well The S&P average annual total return is 7.9% since the 2000 market peak The economy grew 3.8% in Q2 (third estimate), up from the prior 3.3% second estimate Financial conditions remain loose The 10-year Treasury yield has little room to fall from current levels The elderly and poor suffer most from the impacts of inflation Norwood Economics manages diversified portfolios This time is NOT different The S&P might see negative returns over the next decade Economic growth is the lowest in the past 25 years There are no piles of cash sitting on the sidelines The Stock Market
By Christopher Norwood September 22, 2025
Executive Summary The S&P 500 rose 1.2% last week to finish at 6,664.36 The S&P 500 is up 13.31% year-to-date The S&P is expensive The Fed updated its “Dot Plot” The 10-year yield rose last week despite the Fed’s rate cut The Fed is signaling at least two more rate cuts by year's end A pullback of 10% or so wouldn’t be unusual, but there’s no data signaling recession yet The top ten most expensive S&P 500 companies make up over 39% of the market cap UBS economists estimate a 93% chance that the US will slip into a recession this year Investors should review their portfolios before the next bear market The Stock Market
By Christopher Norwood September 15, 2025
Executive Summary The S&P 500 rose 1.6% last week to finish at 6,584.3 The stock market rises long-term due to earnings growth and interest rates A stock is ownership in a business Investors are willing to pay more for a dollar’s worth of earnings today than in the past Profit margins are already near record highs The Volatility Index (VIX) closed the week at 14.76 The market is setting new highs The CME FedWatch tool places the odds at 100% for a rate cut Wednesday The August jobs report and last week’s jobs revision are driving rate cut expectations Cutting the fed funds rate isn’t the answer to slower job growth Higher long-term rates will negate any benefit from a rate cut The Stock Market
By Christopher Norwood September 8, 2025
Executive Summary The S&P 500 fell 0.3% last week to finish at 6,481.50 The CAPE ratio is currently at its second highest reading ever Valuation is a lousy timing mechanism, but an excellent predictor of future returns Interest rates declined last week The 2-Year Treasury yield fell to 3.51% by the close on Friday The 10-Year Treasury yield also fell, ending the week at 4.10%. The CME FedWatch tool has the odds at 73% of a Fed funds rate of 3.50% to 3.75% or lower by year's end The weak jobs report on Friday showed that only 22,000 new jobs were added in August Unemployment rose to 4.3% from 4.2%. The aggregate weekly payrolls index fell to 4.4% in August “We’re back in that world of uncertainty," states Art Hogan, chief market strategist at B. Riley Wealth  The Stock Market
By Christopher Norwood September 2, 2025
Executive Summary The S&P 500 finished down 0.1% at 6,460.26 last week The S&P is up 9.8% on the year. Industrials and Communication Services are leading the way Personal income rose in line with expectations for July, climbing 0.4% up from 0.3% the prior month A weak payroll number on 5 September means a Fed rate cut on 17 September Unemployment is expected to rise, but it is still low relative to history Wage growth close to 4% will make it hard for inflation to fall to 2% The predictions market has the odds of a recession at 8% The ICE BofA US High Yield Index spread is near all-time lows A bear steepener is increasingly likely. A bear steepener is when the yield curve falls at the short end but rises at the long end