Investor Expectations are not Realistic
Market Update
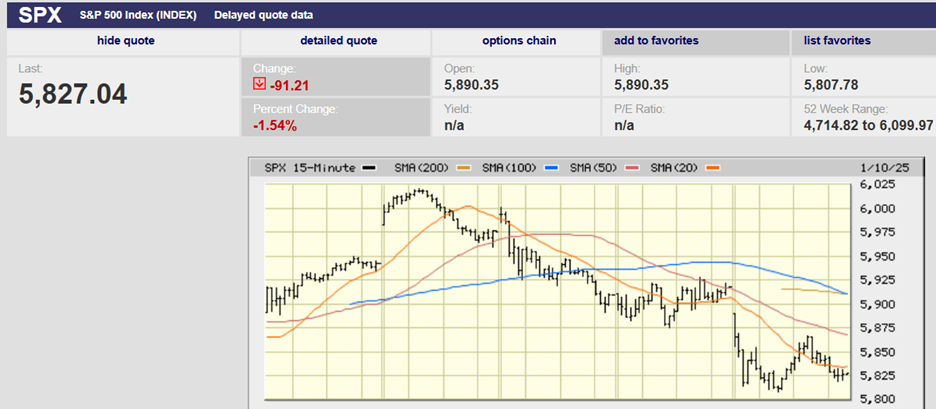
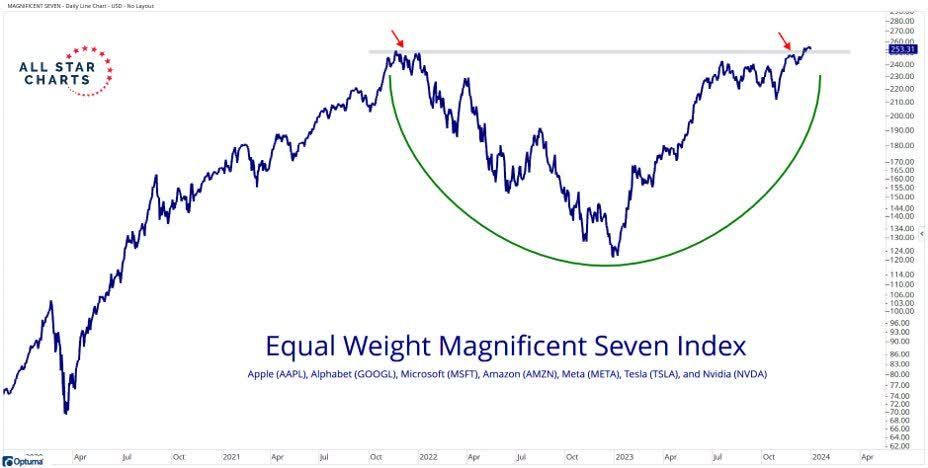
The S&P 500 fell 1.5% last week. The Nasdaq lost 3.25%. Apple fell 5.9%. There is a growing belief that the “Magnificent Seven” will struggle with profit-taking in Q1 2024.
Interest rates rose. The 10-year Treasury ended the week yielding 4.05%. The two-year finished at 4.43% and the 30-year ended at 4.22%. The yield curve is still inverted with the 3mth/10-year at -1.37%. The 3-month/10-year yield curve has predicted every recession since the 1950s. Twice it has inverted without recessions though, first in 1971 and again in 1998. Both inversions were shallower and shorter than the current inversion. The Fed uses the 3mth/10yr as one of the inputs for its recession forecasting model.
The 10-year Treasury rising back above 4% is worrying market strategists. Higher long-term rates compete with stocks for investor dollars. Higher rates also raise company borrowing costs. Many companies will need to refinance in the next few years. Rising interest rate costs will impact earnings and in some cases the ability to refinance. Bankruptcies are already increasing.
The two-year Treasury is yielding 4.43%. It is the Treasury bond which most closely tracks the federal funds rate. It is indicating that the funds rate might stay higher for longer after all. The CME FedWatch tool is forecasting a total of six rate cuts in 2024 with the first likely in March. The Fed’s “dot plot” indicates three cuts. The two-year yield is leaning towards the Fed’s view of things.
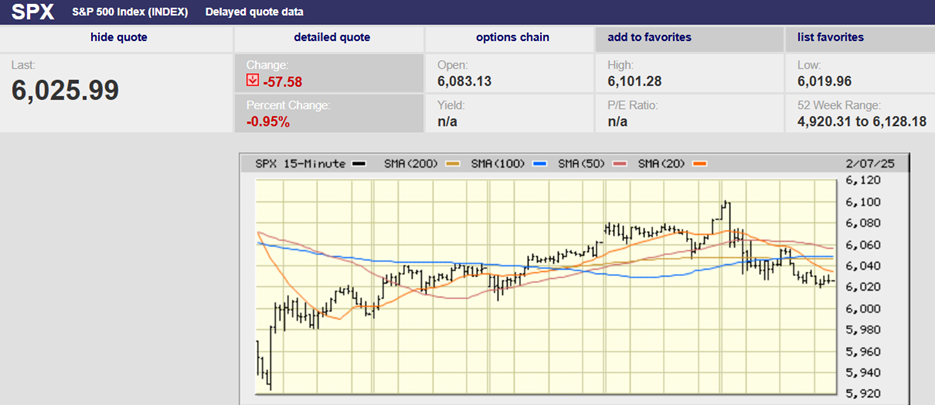
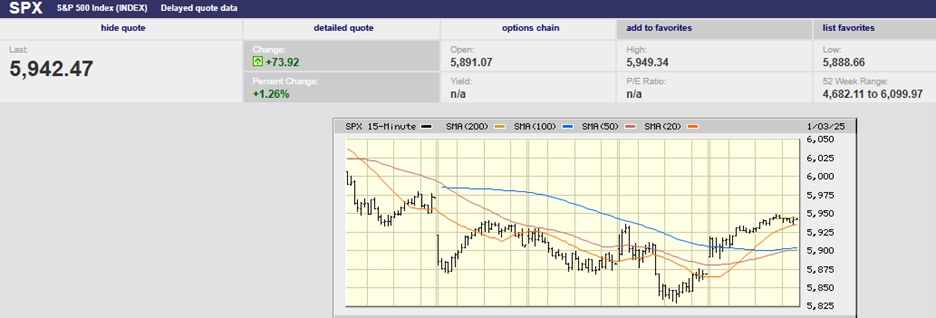
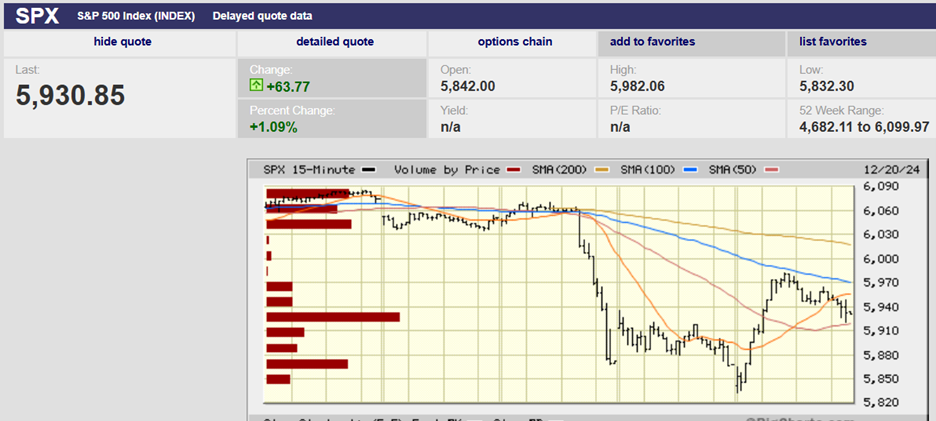
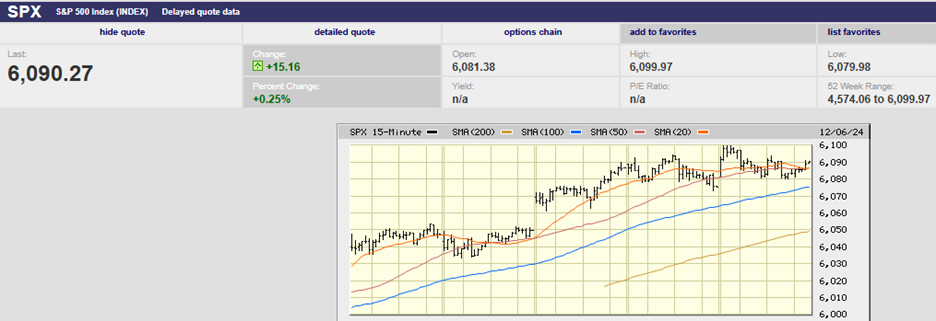
The S&P finished the week at 4,697.24. The index has fallen below the 20-day moving average. It also may be forming a short-term top. The coming week is critical in determining the market’s near-term direction. The short-term overbought condition has lessened with the pullback. A rise back to resistance in the high 4,700s is possible this week. It is equally likely that the S&P will continue lower toward support at 4,600. The 50-day moving average is 4,540. The 200-day moving average is far away at 4,380.
Earnings season starts Friday. A disappointing earnings season with weak guidance will send the S&P lower. Better-than-expected earnings might lead to a new all-time high. Earnings expectations are high though. Earnings are more likely to disappoint than surprise to the upside. The selling over the last five trading days is consistent with routine profit-taking. It's normal to have a period of consolidation after such a strong rally. The S&P had risen some 700 points from 4,103.78 since October 27th before the recent pullback. The 16.8% move higher could easily give back one-third to one-half of the gains without jeopardizing the uptrend.
Banks, airlines, and some healthcare stocks will report Friday. What CEOs say about 2024 will be critical to the near-term direction of the market. Reaffirmation of lofty earnings growth should send the market back toward all-time highs. A cautious outlook is likely to cause the selling to intensify. The market is expensive at around 20x forward earnings. Double-digit profit growth in 2024 is the forecast. Earnings will have to come through if the market is to continue rising.
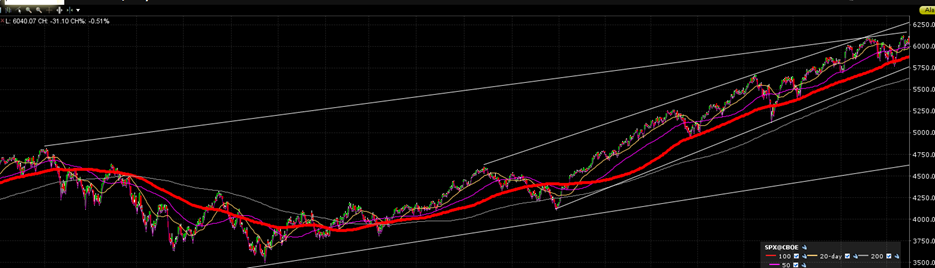
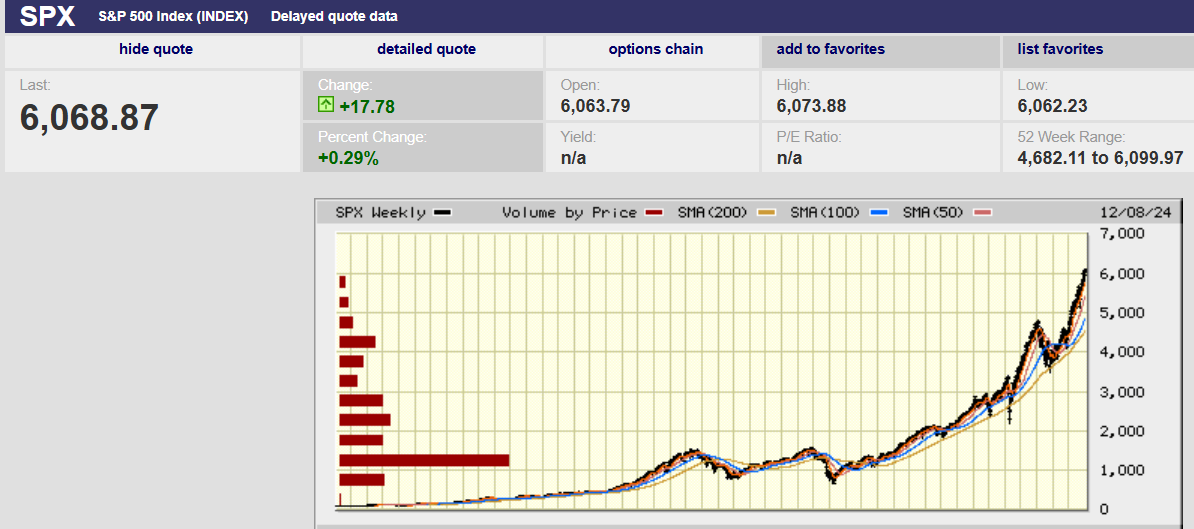
Our view is that we are in a trading range market until proven otherwise. The top of the trading range is around 4,800 and the bottom around 3,500. The S&P is unlikely to break out of the top unless earnings estimates not only meet but exceed expectations. Anything short of outstanding earnings in 2024 is likely to send the index back toward the 200-week moving average, which is at 4,000.
Economic Indicators
The economy gained 216,000 jobs in December. The economy added 173,000 the prior month. The consensus estimate was for a gain of 170,000. Unemployment remained at 3.7%, below the 3.8% estimate. Job gains for October and November were reduced by a combined 71,000, softening the jobs report somewhat. It was still a strong report though. The three-month average of 165,000 is down by half from 2022. It is still above levels consistent with weak wage inflation. It is estimated that the U.S. need only create around 100,000 jobs monthly to absorb the increase in the labor force. Increases above 100,000 ensure a tight labor market and elevated wage growth.
And wage inflation does need to fall. It isn’t where it needs to be for inflation to drop to 2%. Average hourly earnings rose 0.4% in December, or 4.8% annually. Wages rose 4.1% from a year earlier. Strong gains in manufacturing wages and steady increases in the services sector should lift employee compensation by more than 5% in 2024, according to Joseph Carson, former chief economist at AllianceBernstein. Increasing labor costs of 5% or more make it unlikely inflation will continue to fall to the Fed’s goal of 2%.
The CPI report is due out this week. Core CPI year-over-year is forecast to be at 3.8%, down from 4.0% in November. The trimmed mean PCE was 1.5% annualized in November. Trimmed mean PCE is the Fed's preferred inflation gauge.
Investor Expectations
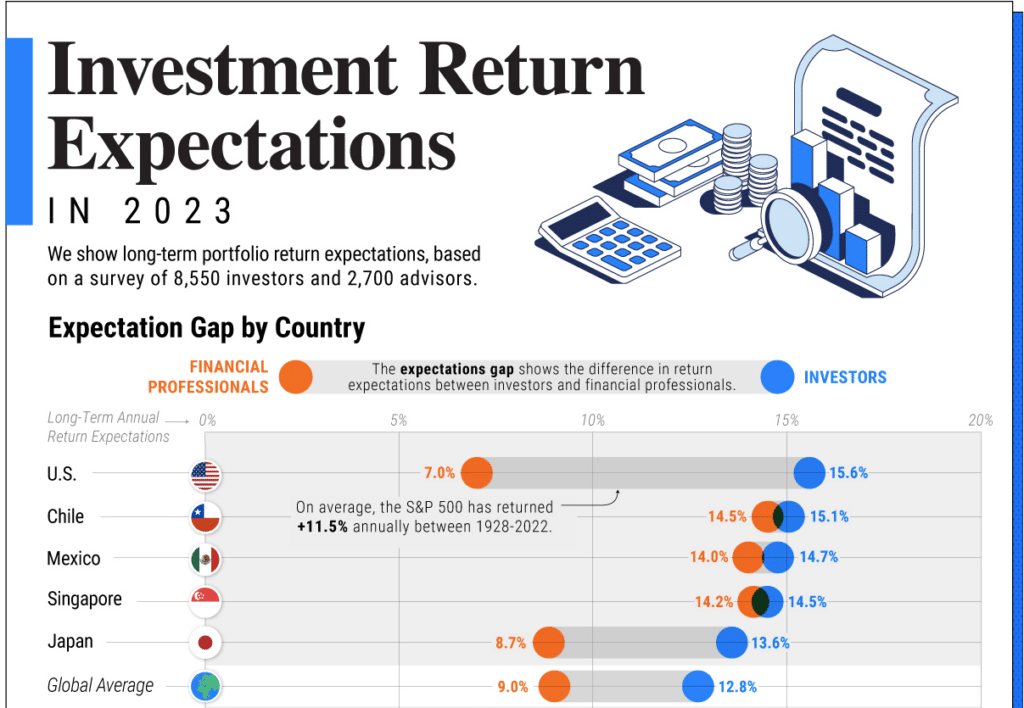
Investor expectations are not realistic, or at least not based on a recent survey of investors and financial advisors. VisualCapitalist published a poll of 8550 investors and 2700 advisors recently. Long-term portfolio return expectations among investors was 15.6% in the U.S. The advisors polled estimated long-term returns of 7.0%. Advisors and investors are far apart in their expectations. They need to have a conversation about realistic return expectations. Otherwise, investors are bound to be disappointed in the coming decade.
Stock returns depend on earnings growth. Earnings growth depends on economic growth. Stock returns therefore are dependent on economic growth. The three move together. Real GDP growth is expected to remain below 2.0% for the next three years.
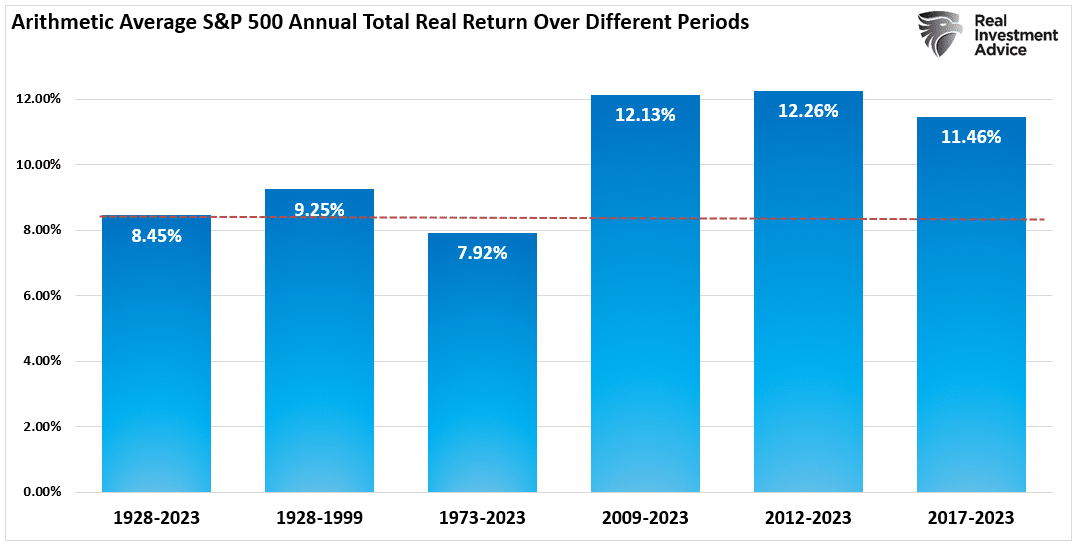
We’ve written recently about corporate earnings growth over the long term, referencing a Federal Reserve study done in 2022. Real net income growth for S&P 500 companies from Q4 2004 through Q1 2022 was 5.4%. Real net income growth would have been 3.6% if it weren’t for falling interest rates and corporate taxes, according to the Fed’s study. Investors need real net income growth of 6% if stock returns are to average 8.5% including inflation. The Fed thinks real net income growth of 3.5% is more likely, well short of 6%. The S&P 500 has a real return of 8.45% from 1928 to 2023, according to Aswath Damodaran of the Stern School of Business. Real returns have been 12.13% from 2009 to 2023. The Fed’s zero interest rate policy, in effect for much of that latter period, elevated stock returns. Large fiscal stimulus packages gave returns an additional boost. Multiple expansion accounts for the rest.
Notice that none of the numbers I’m throwing around come close to the 15.6% return expectations of U.S. investors. It’s more realistic to expect the S&P to return mid-single digits over the next decade. Real earnings growth of 3.5% plus 2.5% inflation gives you a 6.0% return. We pointed out last week that profit margins are elevated. “The S&P profit margin on a trailing 12-month basis is 9.78%, 59% above the long-run average,” we wrote. Profit margins are more likely to be lower, not higher in the coming decade. Also, the S&P is trading well above its long-term average valuation, using price-to-earnings. The S&P is trading at around 20x 12-month forward earnings. The long-term average is closer to 16x. It is not unreasonable to expect a low-single-digit return for the S&P 500 over the next decade given elevated profit margins and an expensive market.
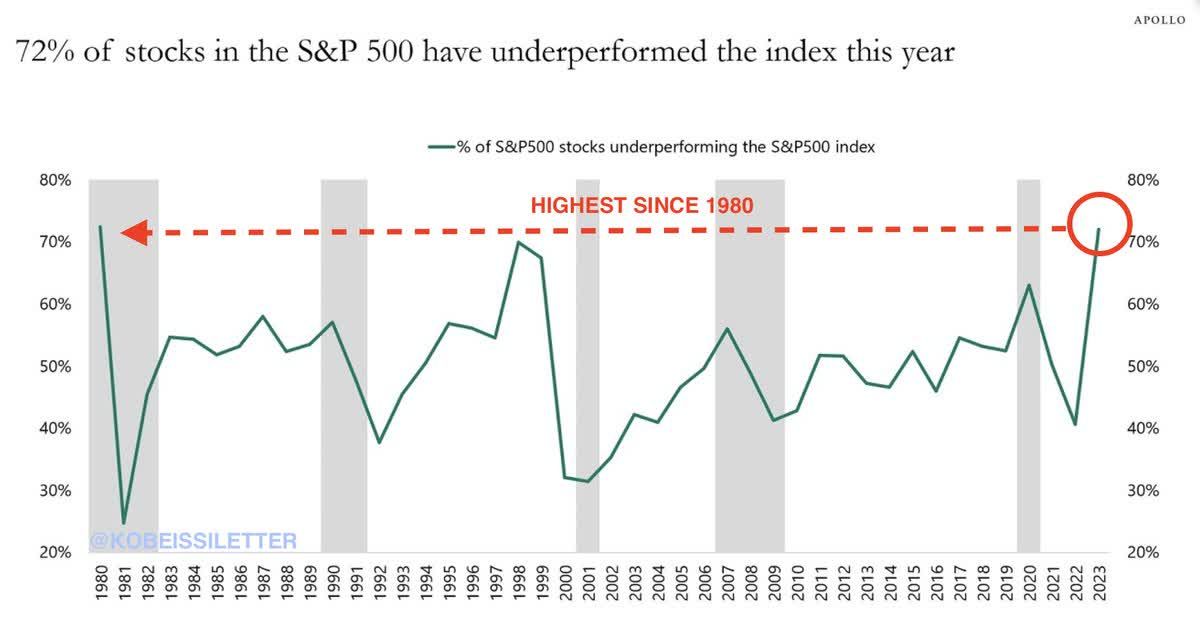
Fortunately, there are other investments besides the S&P 500 index. We wrote last week that small-cap stocks are cheap. International and especially emerging market stocks are also cheap. Finally, we pointed out that there are plenty of cheap stocks in the S&P. Only 27% of stocks in the S&P 500 outperformed the index last year—the narrowest leadership during a rally dating back to 1987, according to Barron’s. There are more than 150 index members trading below 15 times forward earnings projections currently, Barron’s goes on to write.
Crowding into the S&P 500 index for the next decade is almost certainly a mistake. The S&P 500 returned nothing from 2000 to 2013. It returned nothing from 1966 to 1982. It may return nothing in the coming decade. Diversify into other investments. Norwood Economics uses index ETFs to gain exposure to small and mid-cap stocks. Index ETFs also work well for fixed-income and real estate exposure. And don’t forget emerging markets. We use the Vanguard Emerging Market Index (VWO) for our emerging market stock exposure.
Stay diversified. Avoid building concentrated portfolios with the S&P 500 as your main holding. There’s a very good chance you’ll be glad you did in the coming decade.
Regards,
Christopher R Norwood, CFA
Chief Market Strategist