Aggressive Rate Cuts Expected
Executive Summary
- The S&P 500 set an all-time high of 5,733.57 last week
- The Index is up a mere 0.6% since July 16th
- The stock market needs to hold above the new high or risk a move to the bottom of the old trading range, which is at 5,119.21
- Possible catalysts for a correction include the election, a worsening of either war and negative inflation or economic news
- Huge deficit spending will lead to higher interest rates eventually
- Aggressive Fed easing might lead to accelerating inflation
- The neutral Fed funds rate is the subject of disagreement among Fed officials
- The stock market rally has broadened this year, especially since 5 August
Market Update
The S&P 500 rose 1.4% to close the week at 5,702.51. The Nasdaq 100 rose 1.7%. The 10-year Treasury yield closed the week at 3.73% up from 3.66% the prior week. The two-year Treasury yield ended the week at 3.59% down from 3.62% the prior week. The S&P 500 did finally break through to a new high, hitting 5,733.57 on an intra-day basis.
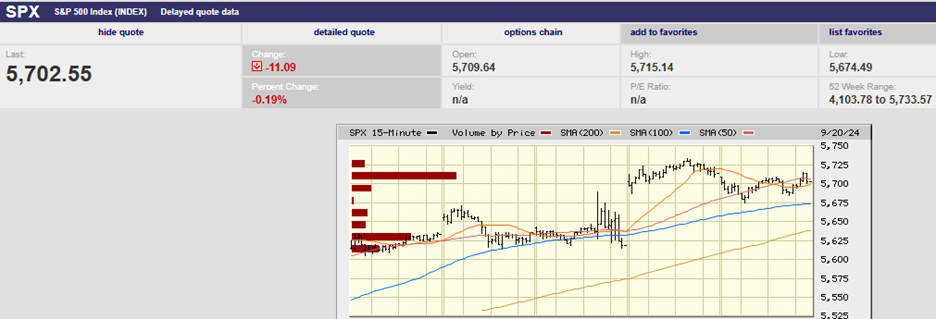
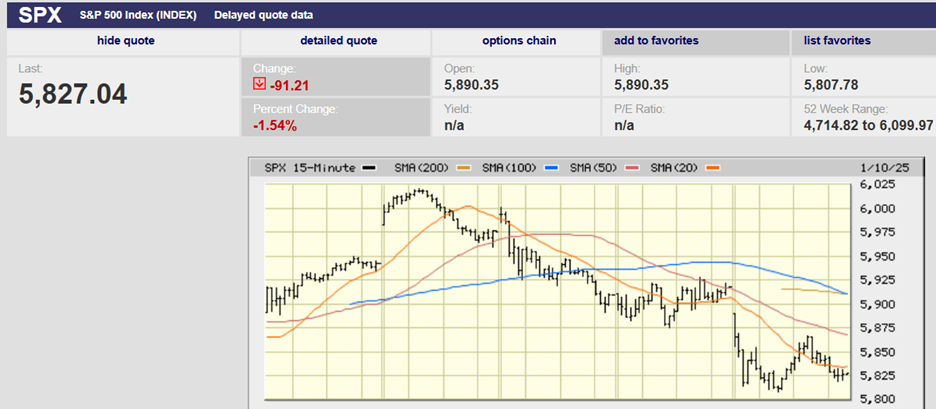
S&P 500 5-Day Chart
Wednesday’s 50 basis point rate cut didn’t get a lasting reaction from investors. The S&P did attempt to rally immediately after the announcement, rising to 5,689.75. Selling came in by 2:15 and the S&P fell back to 5,615.08 by late afternoon. The index finished down small on the day. Traders gapped the market up at the open on Thursday though. The gap up cleared the resistance at 5,640 – 70.
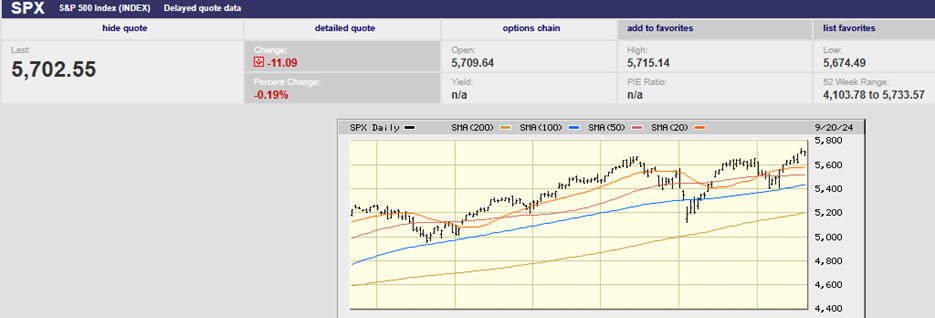
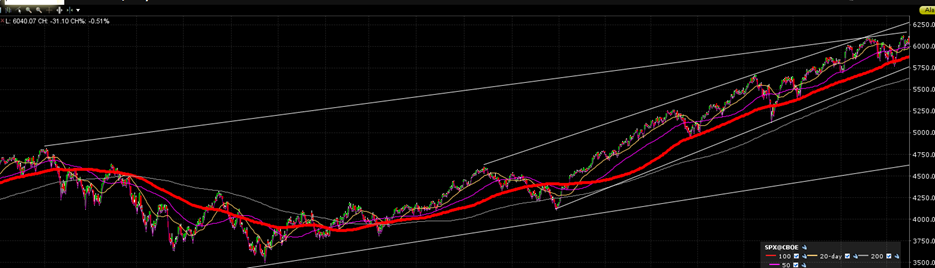
S&P 500 6-Month Chart
Investors will need to build on the breakout now that they’ve climbed the mountain to a new all-time high. Market momentum has waned over the last almost four months. The S&P has only managed a 0.6% gain since the July 16th high. Holding above 5,669 in the coming week increases the chances of another leg up in the bull market. Falling back into the almost four-month trading range increases the likelihood of a bigger pullback. It's known as a false breakout and can lead to a decline to the bottom of the trading range. The trading range is between 5,119.21 and the new high at 5,733.57 for the S&P. There is support at 5,400 and 5,200 though. It will take bad economic data or an exogenous event for any serious pullback to develop. Still the next few weeks should tell us a lot about how the last three months of the year will go.
Possible negative catalysts include the election. There is also the possibility of a worsening of either of the two wars. Negative inflation news or rising Treasury yields might also cause problems for investors. The last is more likely than many investors seem to realize. The yield curve is steepening. It remains to be seen if long rates fall along with shorter-term rates.
The Federal Reserve controls the Fed funds rate, which is an overnight lending rate. It has other tools it can use to influence longer-term interest rates. But the only rate it controls directly is the funds rate. Investors get a say in setting yields along the rest of the yield curve. Investors will demand higher rates if the government issues too much debt. Repayment becomes a concern. They'll want adequate compensation for that additional risk. Also, a concern is the inflation that often follows when a government goes on a borrowing binge.
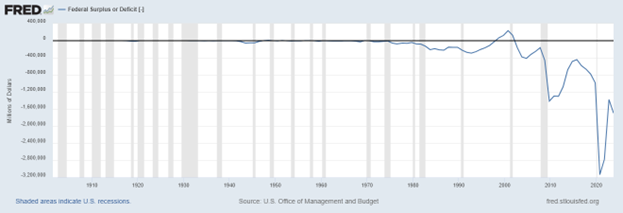
The U.S. has gone on a borrowing binge since 2000.
The consensus narrative is that a soft landing is unfolding. Inflation and interest rates are falling. The economy is growing. Double-digit earnings growth next year is the forecast. It’s a perfect world. Except it’s never a perfect world and, even when it’s pretty darn good, it tends not to stay that way for long.
What if the yield curve steepens because shorter-term yields fall and longer-term yields do not? Continuing, huge deficits might result in higher long-term rates. The deficit for fiscal 2024 will be around $2 trillion after all. The 10-year Treasury yield rose last week, climbing from 3.66% to 3.73%. Keep in mind that the Fed cut the funds rate by 0.50% last week as well. Yet the 10-year yield still climbed. It wouldn’t be the first time that “bond vigilantes” decided to impose fiscal discipline on the U.S. government. The 10-year Treasury yield rose from 5.2% to over 8% from October 1993 to November 1994. Bond investors were concerned about federal spending. Clinton's political advisor James Carville said at the time, "I used to think that if there was reincarnation, I wanted to come back as the President or Pope. But now I would like to come back as the bond market. You can intimidate everybody."
The point of course is that huge deficit spending could cause longer-term rates to rise. Higher longer-term rates in turn would threaten economic growth.
Another potential problem is the Federal Reserve’s penchant for blowing bubbles. The dot.com bubble was the result of too much liquidity in the system. The housing bubble was also the result of too much liquidity. The housing bubble brought the economy to its knees and almost destroyed the banking system in the process. The fact is that the Federal Reserve often miscalculates. Remember the “inflation is transitory” mantra of a few years ago? Oops.
Bank of America (BofA) thinks the Fed’s aggressive half-point cut Wednesday may prime a bubble in risk assets. “The Federal Open Market Committee is seeking to shove down real rates to stave off recessionary jobs cuts by small businesses,” Bank of America said in its weekly Flow Show note Friday. “Wall Street loves ‘panic cuts’ when [there’s] no panic,” Michael Hartnett, investment strategist at BofA, said. Stock and credit markets are now pricing in rate cuts totaling 250bps and 18% per-share earnings growth for the S&P 500 through the end of 2025, Hartnett wrote Friday. It doesn’t “get much better than that for risk so investors [are] forced to chase,” Hartnett said in seeing “bubble risks returning”.
Recession is the top tail risk for 40% of global fund managers who responded to BofA’s September survey of money managers. But concerns that inflation will reaccelerate rose to 18% this month from 12% as well.
The consensus narrative is for the best of all worlds in the coming quarters. It may work out that way. But there are reasons to doubt.
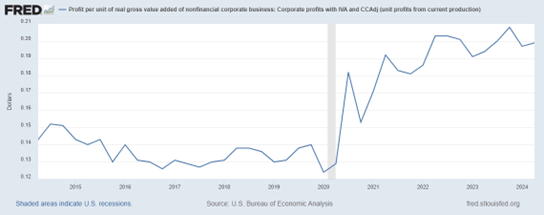
Corporate profit margins are high and historically mean reverting.
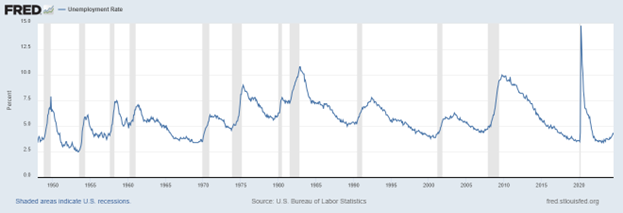
Unemployment is rising.
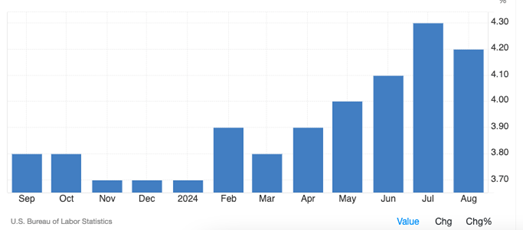
Although from near 50-year lows.
Inflation is falling which means pricing power is waning.
We may not get any further rally in the stock market in the coming months. It’s possible the rally in bonds and stocks has already happened. It wouldn’t be the first time that investors ran ahead of the news.
The stock market is expensive, and profit margins are above their historical average. It’s a combination that can lead to disappointment. For its part, J.P. Morgan is expecting that returns will only average 5.7% over the next decade. The average return for stocks since World War II is 11%, according to Barron’s. Investors can expect only half the reward for taking on the risk of investing in expensive stocks.
Caution is warranted. Risk is higher than normal and risk management remains a priority.
Economic Indicators
The big news last week was the aggressive rate cut by the Fed. Half-point cuts are normally reserved for crises. There are no signs of a crisis now. Chairman Powell portrayed the decision as a “recalibration”. The message he sent was that the Fed was starting to normalize rates, not fix a failing economy. Powell also acknowledged that the Fed would've likely cut the funds rate at its last meeting had it known about the downward revision in jobs growth. That sounds a bit like Powell acknowledging that the Fed has fallen behind in easing monetary policy.
It's all a bunch of baloney of course. The Fed is using lagging data that isn’t particularly accurate when it first comes out. We’ve written about the many revisions to economic data that follow the initial numbers. And then there’s the little problem of the neutral rate. It’s unobservable and unknowable. It’s not possible for the Fed to know how loose or restrictive is monetary policy because Fed officials can’t observe the neutral rate. (The neutral rate is the Fed funds rate that neither restricts nor stimulates the economy.)
There is disagreement among Fed officials about the neutral rate. In fact, the disagreement is as great as it’s ever been. You can see (in the chart below) the wide range of dots in the longer-run projections of the funds rate. The range of neutral rate projections currently spans from 2.375% to 3.75%, a 1.5 percentage point spread.
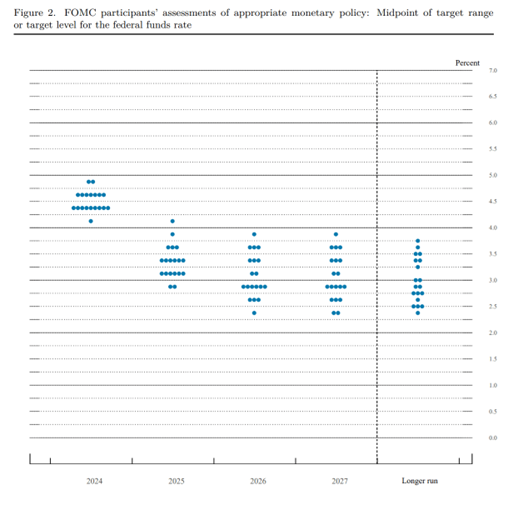
Generally, FOMC members think alike. Their neutral interest rate projections usually cluster on one to three interest rate levels. (see chart below)
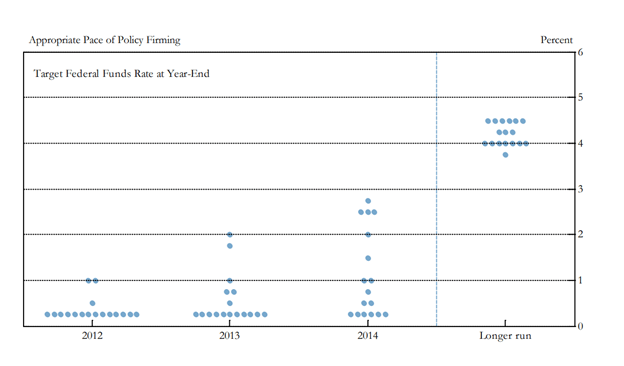
In the chart above you can see that the first-ever dot plot had seven participants picking 4% as their neutral rate. Six picked 4.5%. It has always been the case that at least five Fed officials picked one neutral nominal rate. Not this time. The most recent dot plot has only three members in the largest clusters at 2.5% and 2.75%. It's a sign of uncertainty among Fed members. It means they aren’t sure how restrictive monetary policy is because they can’t identify the neutral rate.
But they are confident the economy is doing fine. Confident enough that they made a “non-emergency” half-point rate cut. “The chairman was saying we’re cutting from a position of strength in the labor market, not weakness,” Kathy Bostjancic, chief economist at Nationwide, told Barron’s. Orwellian doublespeak?
Meanwhile, DoubleLine CEO Jeffrey Gundlach said Wednesday he wasn’t surprised by the Federal Reserve’s big rate cut of 50 basis points. He also said more cuts are needed as the U.S. economy may already be contracting. Gundlach is worth paying attention to given his strong track record as a bond fund manager. Gundlach added that the Fed was “behind the curve”. He said job layoffs indicated the economy was already in recession. Gundlach pointed to the more than 50 basis point drop in the 2-year Treasury yield since July as a recession warning. Other red flags include the high level of consumer debt and rising credit card delinquencies. "I expect to see weaker economic data in coming reports," he told investors. "I still think there's a good shot that the history books will say September ‘24 was a start of a recession,” Gundlach added.
PIMCO doesn’t think the U.S. economy is in recession. The fixed income investment company does believe uncertainty is high. It wrote in a note following the Fed announcement Wednesday that, “The wide range in interest rate forecasts for 2025 – spanning 125 bps among the various officials – highlights the elevated uncertainty surrounding the future of the economy and policy.”
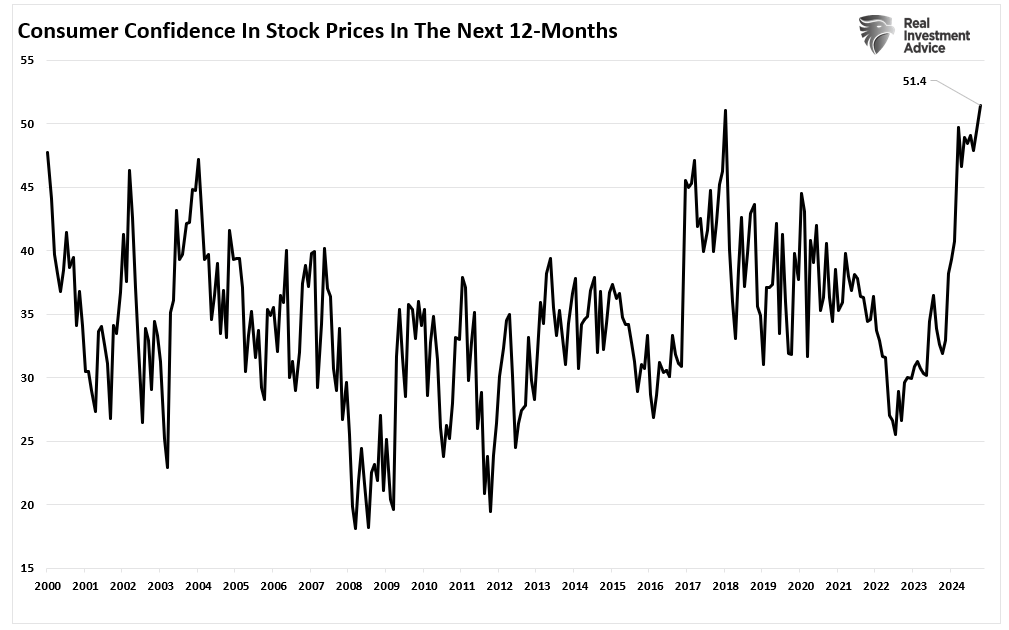
A perfect world it is unlikely to be. We’ll have to see how the next 12 months unfold.
Investing in a Market of Stocks
There is an old saying on Wall Street that it isn’t a stock market but a market of stocks. It’s a reminder that the stock market is made up of individual stocks. Everyone invests in stocks whether directly or through mutual funds. Investors miss a lot if they look only at stock market performance. There's valuable information to be had by tracking individual stocks, industries and sectors. Drilling down can provide valuable information about the economy to investors.
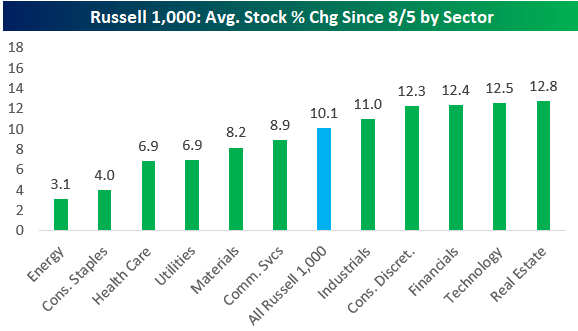
Below are two charts that show that the large-cap rally has broadened since August 5th.
Some things to know about the large cap market:
- The large-cap S&P 500 and Russell 1000 are both now up more than 10% since the summer low made on August 5th.
- Within the Russell 1000, the average stock in the index is up 10% as well, meaning breadth has been strong.
- There are 137 stocks in the Russell 1000 up more than 20% since then (32 trading days), and there are 21 stocks up more than 40%. More than 87% of stocks in the Russell 1000 are up since 8/5
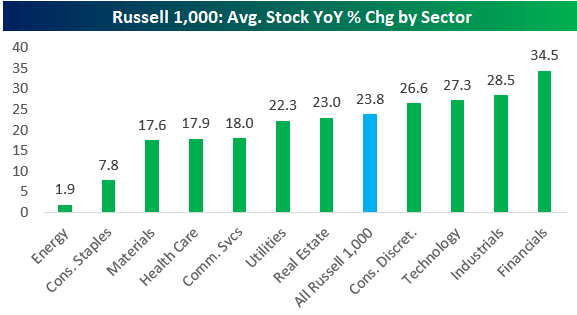
Financials and industrials have outperformed technology over the trailing year (see chart below). Energy and consumer staples are trailing the other sectors. One possible takeaway is that investors are anticipating a soft landing. Economically sensitive stocks are expected to do well while defensive stocks are not (on a relative basis at least).
Regards,
Christopher R Norwood, CFA
Chief Market Strategist