Government needs to borrow 37% more than initially expected
Market Update
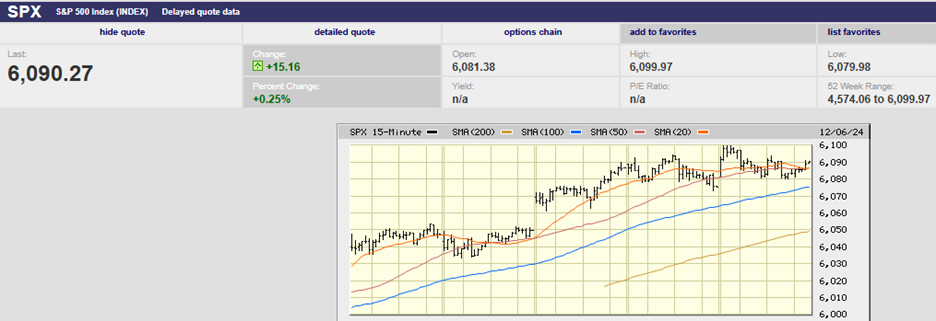
The S&P fell 0.3% last week to finish at 4,464.06. The index bottomed out on Friday, just above the 50-day moving average. The S&P has lost 3.1% since hitting a 52-week high of 4,607.07 on 27 July. We wrote last week that the S&P was likely to see another down week, and it did. We also wrote that the 50-day was a reasonable downside target. The 50-day is at 4,440. There is also support at 4,400. Resistance is at 4,600. The selling appears to be easing. The coming week could go either way depending on the fundamental news.
The Nasdaq fell 1.9% last week. It is down 4.9% in August. The index has already fallen below its 50-day moving average. Profit-taking may not be over in the technology sector. The Nasdaq led on the way up during the first seven months of the year and is leading on the way down so far. Rising long-term interest rates may be the culprit. Growth stocks are more sensitive to interest rates. Future earnings discounted at a higher interest rate reduce their present value.
Long-term rates are rising faster than short-term rates. Long-term rates may be rising faster because economic growth is increasing. A steepening yield curve may be the result of an accelerating economy. Long-term rates can also rise faster than short-term rates because of too much supply. The latter is a likely possibility. The Treasury made a surprise announcement at the end of July. It announced that it would be borrowing $274 billion more than previously thought.
Increasing the borrowing amount by 37% is more than enough to cause yields to rise. Government borrowing crowds out private borrowing, causing rates to rise. It is basic macroeconomics. Rising long-term rates in turn depress economic growth. It's possible that is why stocks sold off on Thursday. A disappointing 30-year Treasury bond auction pushed rates higher. Rising rates may have caused traders to sell stocks. A continued rise in long-term rates would pressure the stock market.
Regardless of the reason, higher long-term rates will also pressure the economy. A slowing economy means slower corporate earnings growth. The S&P is trading at almost 20x forward 12-month earnings already. Higher long-term rates and slower earnings growth will hit the stock market in two ways. First bonds will be a more attractive alternative to stocks because of higher yields. Second, slower earnings growth means stocks are more expensive. Prices will need to fall to keep the market at 20x earnings. Prices already need to fall to bring the market back to a more normal 15x-16x earnings.
Falling long-term interest rates send a different but equally negative message. Long-term rates are unlikely to fall much unless the economy is heading into a recession. The stock market isn’t priced for a recession. The consensus forecast for 2024 is for 12.2% earnings growth. Analysts are forecasting 11.9% earnings growth for 2025.
The economy has grown between 1.5% and 2.0% on average since the Great Recession, or nominal economic growth of 4.0% to 5.0%. Earnings growth tracks economic growth over the long run. That is the case because profit margins are mean reverting. There would be something wrong with capitalism if that no longer held true. Excess profits are competed away, and margins revert to normal. Earnings grow in line with sales over the long run.
All of which means that double-digit earnings growth isn’t sustainable. Mid-single-digit earnings growth on average is all we can expect from an economy growing nominal GDP by 5% to 6%. And we shouldn't expect even mid-single-digit earnings growth over the next few years. Instead, the odds favor slower than normal economic growth because of Fed rate hikes.
The real Federal Funds Rate (FFR) reached a record low in March of 2022 of negative 5.2%. The real FFR is now at 1.8%, an increase of 7% in 15 months. This is a larger increase than before the Great Recession. Furthermore, money supply growth is negative, contracting at a 3.27% rate. Money supply hasn’t contracted as fast since the Great Depression. The Fed's Quantitative Tightening (QT) program is responsible. It is shrinking its balance sheet, pulling liquidity out of the economy.
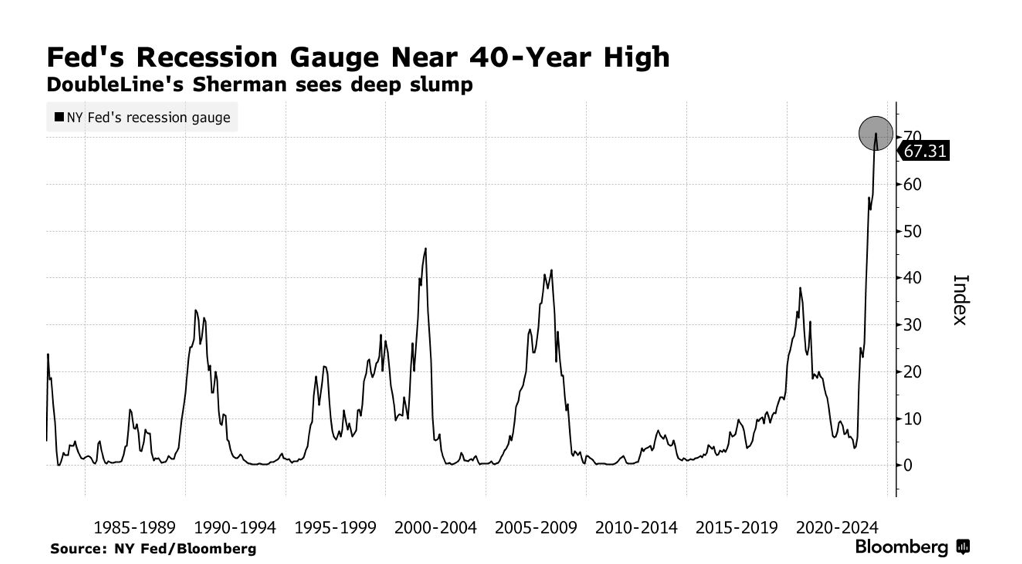
Tax receipts are already falling. Falling tax receipts precede recessions. Also, Gross Private Domestic Investment (GPDI) as a % of GDP is falling. GPDI is also a leading indicator and falls heading into a recession. It is more likely than not that the U.S. economy will be in recession in 2024. Falling tax receipts, M2, and GPDI, and the leap in the real federal funds rate are all pointing to recession. Earnings usually fall around 20% during recessions. The stock market usually falls 30% or so in anticipation of a recession. Risk management remains a priority.
Economic Indicators
The big news last week was the consumer price index (CPI) report. Core CPI rose 0.2% in July as expected. Core CPI year-over-year rose 4.7%, also in line with expectations. The year-over-year number is down from 4.8%. The core CPI confirmed that inflation continues to subside. It’s unclear whether that trend will continue next month. The swaps market is expecting inflation to rise in August to 3.6% y/y before falling to 3.5% in September. The swaps market is projecting inflation to remain between 3% and 4% for the rest of the year. Bloomberg is estimating that core CPI will be at 4.2% by September.
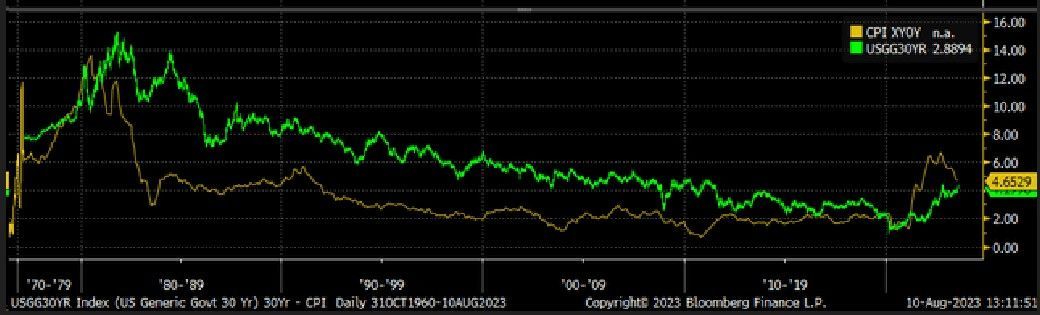
The 30-year Treasury usually trades above the core CPI rate (see chart below). The 30-year Treasury traded more than 1.05% above the core CPI from 2011 to 2019 according to Mott Capital. That would put the 30-year Treasury above 5% instead of the current 4.25%. Core CPI needs to fall to 3.2% for the current 30-year Treasury yield to match the average from 2011 to 2019. It is possible inflation will fall and the 30-year Treasury yield will not rise. It is also possible that long-term yields will rise if inflation doesn’t fall as quickly as expected. Higher long-term rates would be bad for the economy and the stock market.
Opportunity Cost, Investing, and Social Security
Norwood Economics gets questions all the time about how best to deploy savings. The most common is whether a client should pay off their mortgage before retiring. The answer depends on the interest rate on the loan and what else you can do with the money (opportunity cost). A married couple heading into retirement with a 3% mortgage should not pay off their mortgage. A diversified portfolio of 60% stocks and 40% bonds should earn 6.5% on average. Earning 6.5% is better than saving 3% in interest payments on your mortgage.
A second common question is when to take social security. It’s a math problem along with an educated guess. The educated guess is how long you’re likely to live. Life expectancy for someone in their mid-60s is mid-80s. The math problem calculates your break-even year. It answers the question of how long it takes to make back foregone payments.
The government website says that the maximum benefit at age 62 in 2023 is $2,572 monthly. The maximum benefit is $3,627 if you start social security at full retirement age. It is $4,555 if you wait until age 70. The early retirement age benefit is 71% of the full retirement age benefit. It is 56.5% of the age 70 benefit.
The breakeven for waiting until FRA instead of taking social security at age 62 is a little more than 12 years. In other words, you’re ahead if you live to be at least 79 years of age. The breakeven for waiting until you’re 70 years of age instead of starting at 62 is a little more than 10 years. In other words, you’re ahead of the game if you live until at least 81 years of age. The breakeven for waiting until 70 years of age instead of FRA is a little less than 12 years. In other words, you (or your spouse) need to live until at least 82 years of age.
The life expectancy of a 67-year-old in the United States is 16.5 years for a male and 18.9 years for a female. It is 14.4 years for a male at age 70 and 16.6 years of age for a female. The odds are in your favor if you wait until age 70 before taking social security. They are also in your favor if you wait until FRA instead of taking social security at age 62. The odds are more in your favor if you have money. People with money have better healthcare throughout their lives. People with money live longer.
But math doesn’t tell the whole story. Social security isn’t just a monthly check. It is longevity insurance. The risk you are insuring is the risk of outliving your assets. Many people seem to worry about dying before they’ve broken even on social security. Few seem concerned about what happens if they live well into their 90s, as more and more people or doing. That social security check becomes increasingly important as you spend down your assets in your 80s and 90s. Something to think about before rushing to the social security office at 62.
Regards,
Christopher R Norwood, CFA
Chief Market Strategist