- Rotation out of tech and into small-caps
- Norwood is forecasting a recession for late 2024-early 2025
- a recession would lead to a bear market
MARKET UPDATE
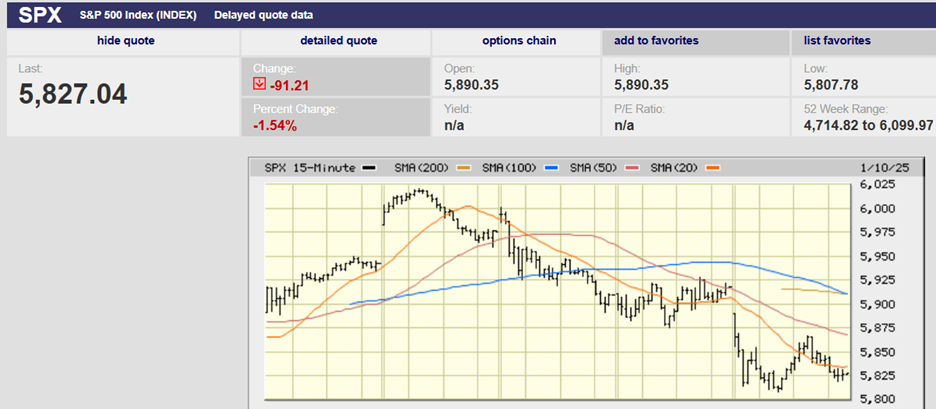
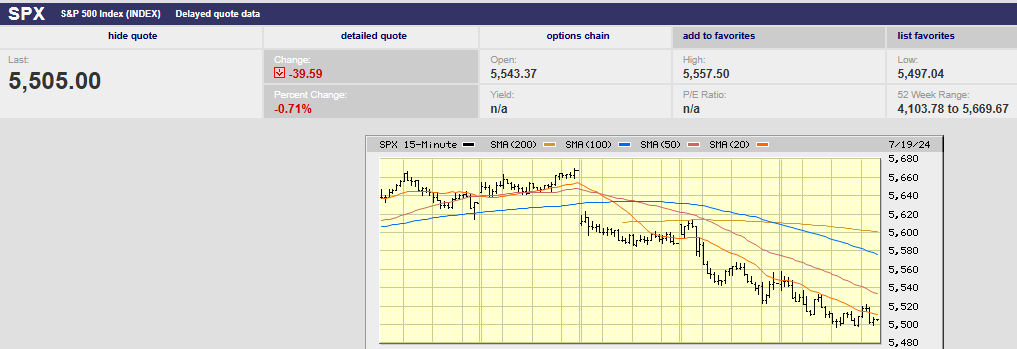
The S&P fell 2% last week to finish at 5,505.00. The index closed at the 20-day moving average on Thursday. It dropped below the 20-day moving average on Friday, falling as low as 5,497.04. It hit the low for the day and week around 1:15 p.m., tried to rally but failed. The close below the 20-day moving average on Friday opens the door for a continued pullback. The 50-day moving average is at 5,400. The 100-day moving average is at 5,280. The 200-day moving average is at 4,950, about 12.7% below the 52-week high. A pullback to the 200-day would be entirely normal. That is especially true given the large rally since October of 2023.
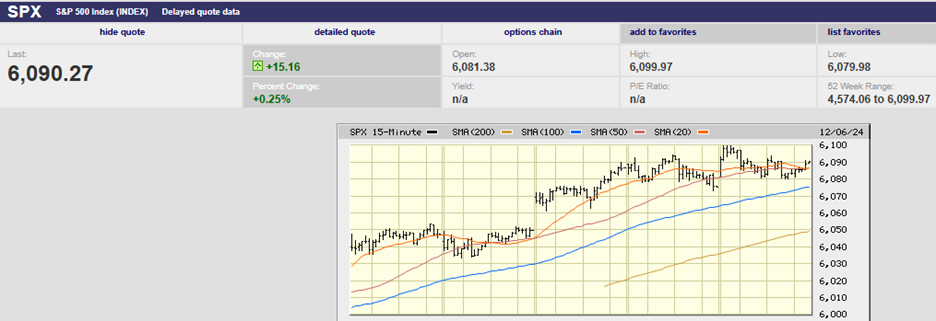
5-day S&P 500
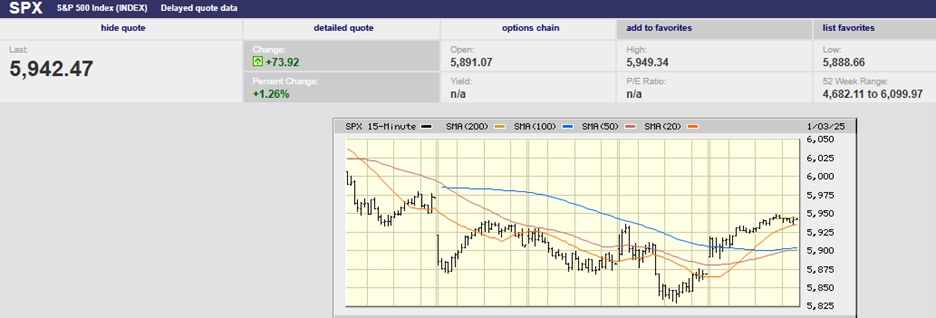
Aside from the moving averages, the first real support is the June consolidation area. The S&P traded sideways for fourteen trading days in June and early July. The index set highs of 5,447, 5,442, 5,432, 5,488, 5,490, 5,505, 5,478, 5,491, 5,473, 5,483, 5,491, 5,524, 5,480, and 5,510 during that fourteen-day stretch. The S&P broke free from the consolidation zone on light volume on 3 July. It moved steadily higher until peaking on Tuesday of last week at 5,669.67. A test of the consolidation zone by traders would be normal. Earnings season has started. Weaker than expected earnings or guidance would make a breach of the consolidation zone likely.
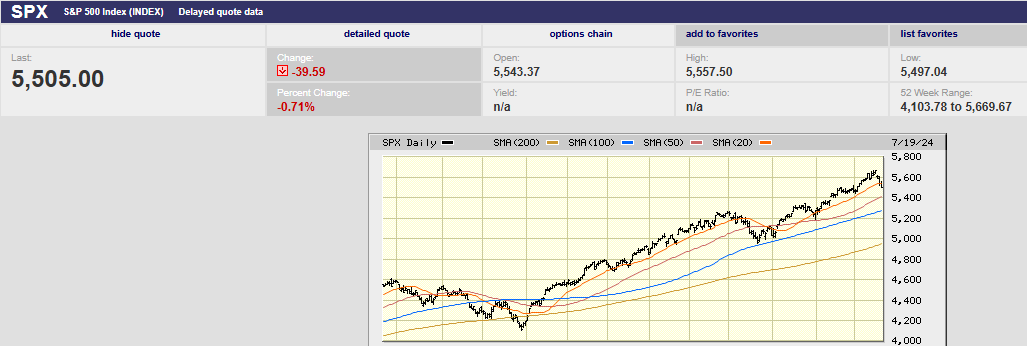
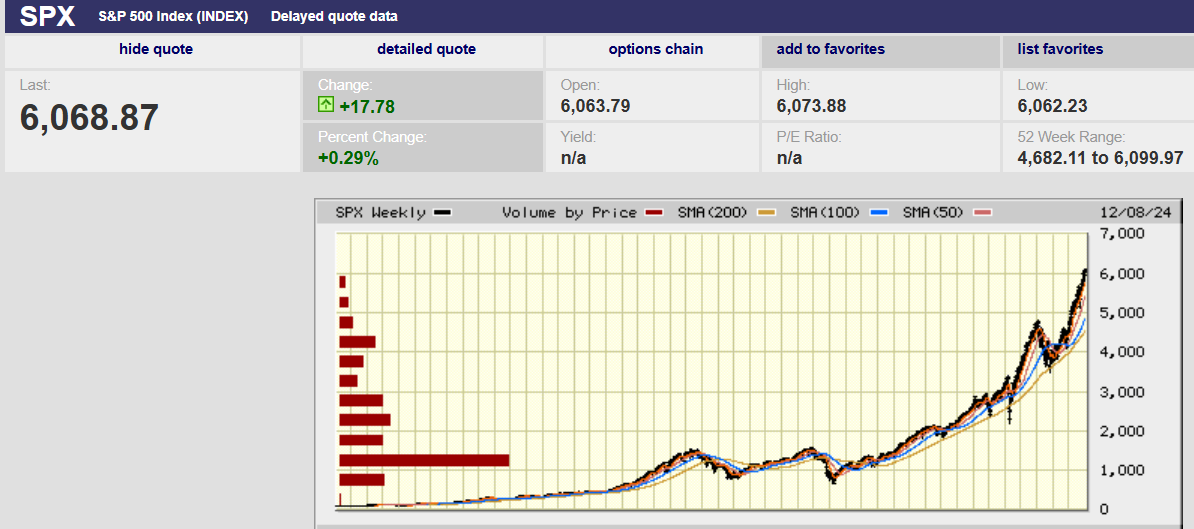
1-year S&P 500
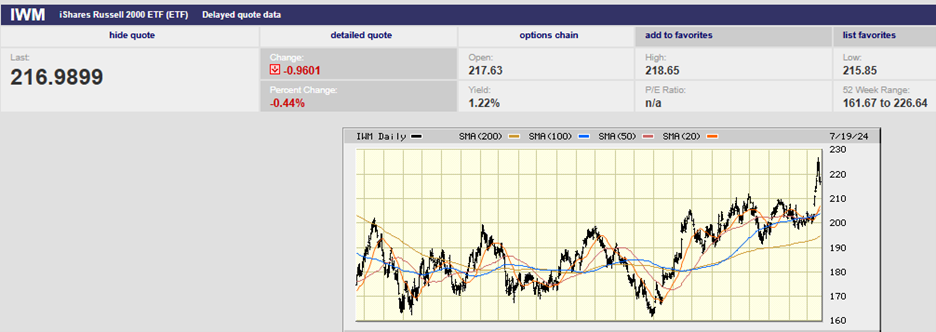
Meanwhile a rotation out of the largest capitalization stocks has begun. "Rotation is the key word in financial markets at the moment, as the leadership of the U.S. market has very rapidly shifted away from the Mag-7 to the wider market," one Bloomberg Analyst said on Wednesday. Bloomberg went on to report that the "momentum trade has fallen off a cliff", noting that the "40-day correlation between the Nasdaq Composite and Russell 2000 is usually over 60%. It just hit 0."

The Invesco S&P 500 equal weight exchange-traded fund is up 4.9% over the past five trading days, according to a Wednesday mid-afternoon note from Barron’s. The S&P has underperformed the equal-weight index by 3.2% during that five-day stretch. Money is flowing into small cap stocks as well, Barron’s pointed out in the same mid-afternoon note. The Russell 2000 small-cap index has gained 11.5% over the past five trading days (through last Wednesday morning), according to Barron's. The smallcap index has beaten the S&P by 9.9% during the 5-day stretch. It is the largest five-day performance gap between the two since at least 1986. At least some of the small cap launch higher was likely due to short covering.
Morningstar Research's chief U.S. market strategist David Sekera believes the market is over-extended, Seeking Alpha reported. He added that it may also stay like that for some time. “According to our valuations the stock market is not only stretched but is starting to trade pretty far into overvalued territory,” Sekera told Seeking Alpha Thursday. Sekera went on to say that there is a likelihood the stock market would remain overvalued for some time. He said investors would need a clear reason to begin selling.
The latest year-end price targets for the S&P 500 from market strategists are modest. Evercore has the most ambitious target at 6,000. Most strategists are calling for a year-end number in the mid-5,000s, about where the index is now. The most bearish strategist is at JP Morgan. He’s calling for a year-end S&P number of 4,200, 1305 points below Friday’s close, a 23.7% decline.

Norwood Economics is forecasting a recession in late 2024 or early 2025. We are non-consensus at this point. Most economists don't see a recession until late 2025 at the earliest. BCA Research is on the same page as Norwood Economics though. The independent global investment research firm sees consumer spending faltering. Excess Covid savings are gone, and the jobs market is weakening. It also sees business investment faltering due to higher interest rates. "Thus, the two private-sector domestic drivers of U.S. activity are likely to slow," it wrote in a recent note. "We continue to expect a recession to begin in the U.S. in late 2024/early 2025," BCA Research went on to write.
Norwood Economics agrees.
We see a 15% pullback in the stock market sometime this year as likely assuming no recession. We expect a 20% to 30% decline over the next six to twelve months if a recession does show up. Limited upside along with increased downside risk makes risk management a priority. Good companies on sale should be bought during any pullback.
Economic Indicators
U.S. retail sales were flat in June. They were up 0.3% the prior month. The report was better than expected as economists were forecasting a decline of 0.4%. Retail sales minus autos rose 0.4% in June, also better than expected. Economists had forecast a rise of 0.1% minus autos, the same as in May. Housing starts and building permits both rose in June. They both came in better than expected as well.
Initial jobless claims were weaker than expected. They rose to 243,000 from 223,000 the prior week. Economists had forecast 229,000. Initial claims are approaching their upper bound since 2022. It’s too early to tell if initial claims have begun to trend higher.

The U.S. leading economic indicator (LEI) was negative 0.2% in June, better than the negative 0.3% forecast. The LEI was negative 0.4% in May. It was the fourth decline in a row. The LEI had fallen for two years before turning positive briefly in February.
The Conference Board Expectations Index fell to 73.0 in June, down from 74.9 in May. The Expectations Index has been below 80 for five consecutive months. Eighty is the threshold which usually signals a recession, according to the Conference Board. “Confidence pulled back in June but remained within the same narrow range that’s held throughout the past two years, as strength in current labor market views continued to outweigh concerns about the future. However, if material weaknesses in the labor market appear, confidence could weaken as the year progresses,” said Dana M. Peterson, Chief Economist at The Conference Board. The Conference Board sees the economy slowing in the coming months. It is forecasting lower consumer spending. The Conference Board sees GDP growth slowing to around 1 percent by Q3.
Initial GDP for the second quarter comes out on Thursday. The forecast is for 1.9% growth, still above the Fed’s estimate for non-inflationary growth. The Atlanta Fed GDPNow tool is forecasting second-quarter growth of 2.7%. An upside surprise of that magnitude might dash investors’ hopes for a September rate cut. An economy growing at 2.7% with core PCE at 2.5%, and still low unemployment hardly seems a candidate for rate cuts – if the Fed is data dependent.
Monetary Policy: A Game of Marco Polo
Interest is the cost of money. Capital (money) is one of the four main inputs to the economy. Land (resources), labor, and technology are the other inputs. The real interest rate is the rate you pay minus inflation. The neutral rate is the real rate that neither stimulates nor retards economic growth. There is more than one real interest rate. There is an entire yield curve that extends from overnight loans out to 30-year bonds. The yield curve changes shape because of monetary policy. It also changes shape because of fiscal policy. The yield curve is currently inverted. Short-term interest rates are higher than long-term interest rates. That isn’t normal. Investors normally demand a higher yield for longer maturities. There is more uncertainty and therefore more return expected.
The yield curve inverts when the Federal Reserve raises the Fed funds rate. The Fed raises the Fed funds rate when inflation is rising. A rising cost of money leads to reduced aggregate demand. Reduced aggregate demand means less inflation, eventually. Real interest rates aren’t directly observable. Neither is the neutral rate. The neutral rate is a best guess. Inflation is a best guess as well for that matter. The CPI, core CPI, PCE, core PCE, and trimmed mean PCE are all inflation measures. Which one is best for estimating the real interest rate and neutral rate? Regardless, the numbers are stale when released. The numbers tell us what inflation was, not what it is.
As with the game of Marco Polo the target is always moving. We are left to grope blindly for the true cost of money.
The Fed is going to cut the Fed funds rate in September. The CME FedWatch tool has the odds at 94%. The Fed hates to surprise the markets. It will need to change expectations quickly if it isn’t planning on cutting in September. The CME FedWatch tool has the odds of two cuts by year-end at 91.5%. But how much will it cut over the next year? On what will it base its monetary policy? It needs to reduce rates below the neutral rate to stimulate the economy, thus keeping it out of recession. The problem is that no one knows where the neutral rate is - Marco….Polo.
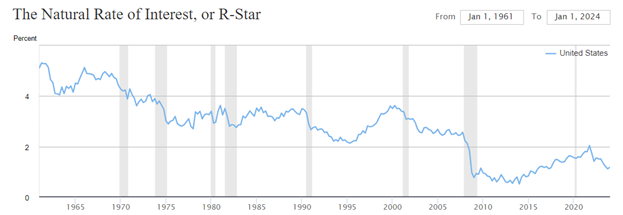
A New York Federal Reserve model shows that the neutral rate has fallen. The model has the neutral rate at roughly 1.2% as of this year’s first quarter. That’s up from a decade ago. But it’s down from the roughly 3% level that prevailed in the 1980s and 1990s (see the chart below).
Estimating the neutral rate is difficult. There are ongoing debates about the best approach. Estimates vary widely. Some economists believe the neutral rate has increased. The Fed should not cut rates much if that is the case. Other economists believe the neutral rate is still around 0.5%. The Fed needs to cut aggressively to stimulate the economy if that is the case. Marco….Polo.
Reuters reported in May that a New York Fed survey of major banks ahead of the March meeting found dealers estimating, “a longer-run rate of nearly 3%, up from 2.5% the prior March.” A neutral rate of 3% means the Fed would need to cut less. Analysts at TD Securities told clients in a recent note, “we continue to assume that the long-run neutral rate is now likely 50 basis points higher at 2.75%-3.00%, but can’t discount a somewhat higher level closer to 3.50%.” And the San Francisco Fed said in a report its in-house view on the longer-run rate stands at 2.75%. Marco...Polo.
The stakes are high in this technical debate for the future path of monetary policy. If the neutral rate has increased, that will limit how much the Fed can cut. “If they’re gonna do two [cuts] this year, they’re effectively going to be at neutral by the end of the year,” says Jim Bianco of Bianco Research. “Given the strength of the economy, I don’t think it’s warranted.”
Marco…Polo
Regards,
Christopher R Norwood, CFA
Chief Market Strategist