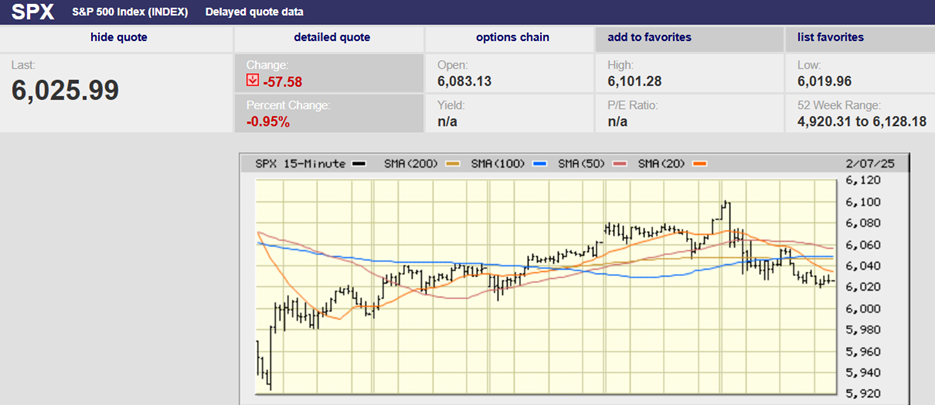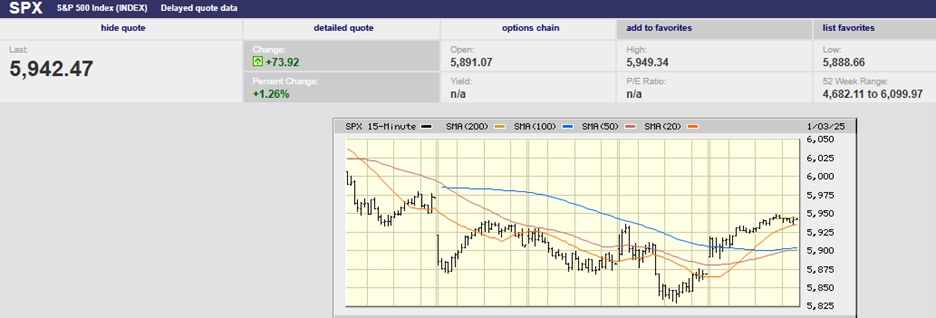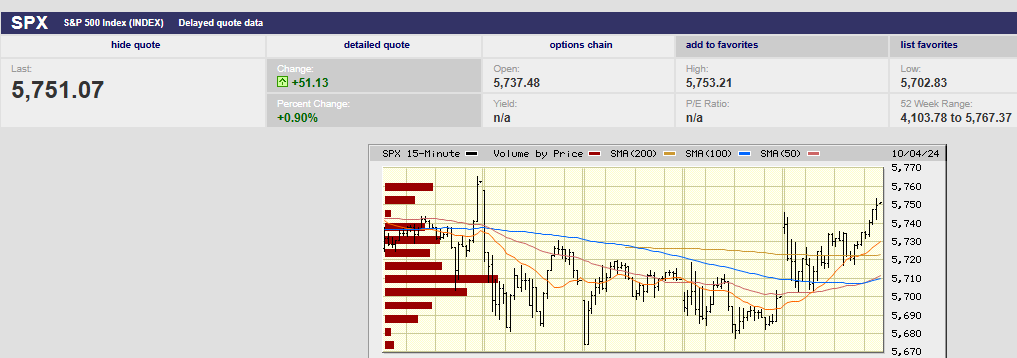
5-day S&P 500 chart
Executive Summary
- S&P uptrend is intact, gains likely into year-end
- Goldman Sachs raised its 12-month forecast for the S&P 500 to 6,300 on Friday
- Interest rates continue to edge higher which may impact stocks
- Friday's payroll report was stronger than expected
- The FED may not be able to cut rates as much as the market expects
- Real interest rates aren't that high
- The 30-year fixed mortgage isn't that high either
Market Update
The S&P 500 rose 0.2% last week to finish at 5,751.07. The Nasdaq 100 rose 0.1%. September gains in the S&P sets the stage for more gains through year-end. Norwood Economics wrote last week that, “The S&P’s uptrend is intact. The rally has broadened, a positive. September is coming to an end and a momentum-fueled run into year-end is expected. The base case is for the S&P to climb higher into year-end.”
Goldman Sachs raised its 12-month forecast for the S&P 500 to 6,300 on Friday. Goldman said its three-month target is 6,000. The investment firm raised its earnings growth forecast for 2025 to $268, or 11% growth year over year. Bank of America chimed in with an observation Friday as well. "The market has risen in the fourth quarter 79% of the time after September gains," the bank wrote in a note to clients. The average advance is 5.1%. “The technicals are very strong,” Mahoney Asset Management’s Ken Mahoney told Barron's last week.
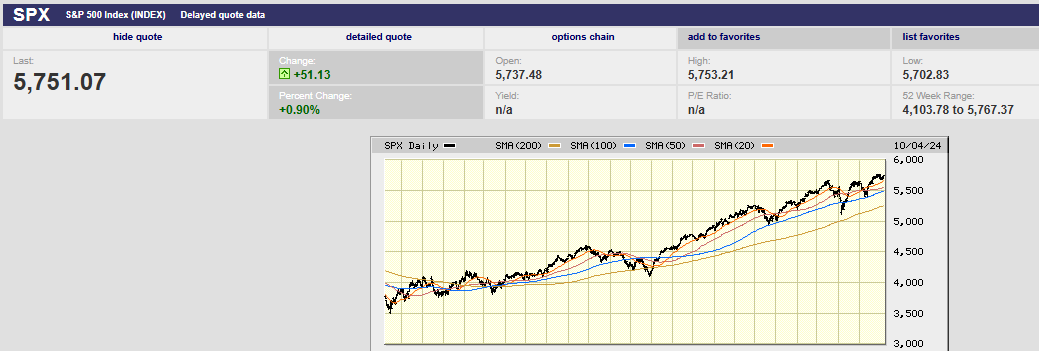
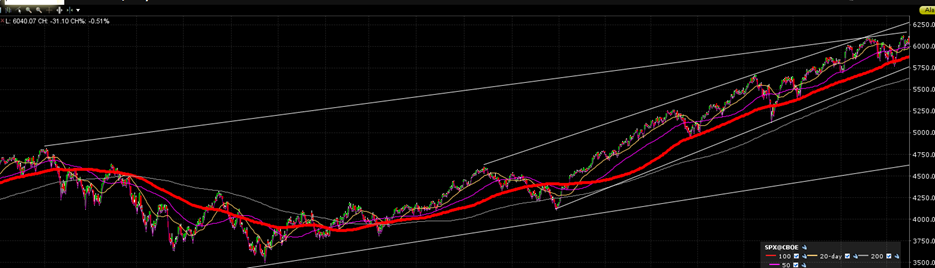
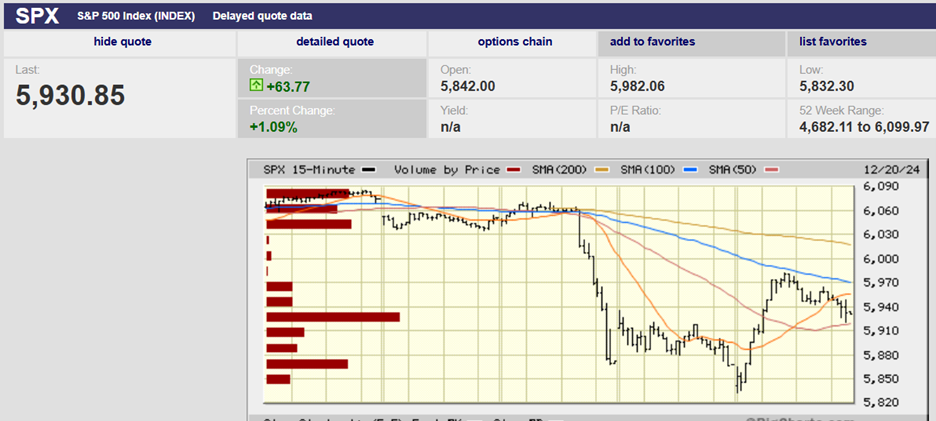
2-year S&P 500 chart
One possible negative is that interest rates continue to edge higher. The 10-year Treasury ended the week yielding 3.97%. It was yielding 3.62% on 16 September, two days before the Fed cut the funds rate by half a point. The two-year Treasury ended the week yielding 3.95%. It was yielding 3.59% a week ago. The bond market is backpedaling on the number of rate cuts coming as well. The futures market priced in aggressive cuts following the weaker-than-expected August jobs report. It took some of those cuts off the table following the strong September jobs report last week. Payrolls jumped by 254,000 in September, more than 100,000 above the consensus estimate. Job growth was also revised up by 72,000 in the two prior months. Unemployment fell to 4.1% from 4.2%.
Economic activity was revised up for the second quarter as well. Gross Domestic Income (GDI) is the other side of the Gross Domestic Product (GDP) equation. GDI equals GDP because income must equal expenses. GDI was revised up to show 3.4% annual real growth in the second quarter. It was a big bump from the original 1.3% number. Personal income was higher than thought also. The higher personal income translated into a savings rate of 5.2% rather than the initially reported 3.3%. Higher personal income helps explain the continued strong consumer spending. The October 1st GDPNow estimate did drop to 2.5%, down from 3.1% September 27th. But that is still strong growth for the U.S. economy.
We wrote last week that, “The Fed may not be able to cut as much as it would like if pricing pressures returned given an apparently strong economy with inflationary hotspots.” Capital Economics Chief North America Economist Paul Ashworth has had the same thought. He wrote last week that the higher GDI means the risk of rising core inflation has reversed to the upside.
We also wrote last week that, “The Fed seems determined to cut further despite record stock market highs, tight credit spreads, record gold prices and a GDPNow forecast for Q3 of 3.1% (now 2.5%). The 3.1% (2.5%) forecast is above the sustainable non-inflationary rate, estimated at 1.8% by the Fed. Wage growth is at 4.6%. Sticky price inflation is trending down but still at 4.10% as of August. Initial jobless claims last week were a low 218,000 down from 222,000.”
The latest jobs report saw wage growth accelerating. The services sector reported wages increased by 4.9% year-over-year. The services sector wage increase feeds into the cost of labor for service sector firms. The stickiness in services compensation costs is also reflected in the services PMIs this week. The services PMIs showed high readings for service sector prices. Meanwhile, overall wages rose 0.4% month-on-month in the September jobs report. August’s wage growth rate was revised up 0.1% to 0.5%. September’s 0.4% wage growth rate annualizes to 4.8%, well above the rate needed if inflation is to fall to 2.0%.
That's if the numbers are right. Because the jobs report strength doesn’t match other data. ISM, NFIB, and the Fed's Beige Book are all casting doubt on the September payroll report. The sharp fall in the quits rate also casts doubt. A fall in the quits rate usually means a coming slowdown in wage growth, not an acceleration. Households themselves are telling survey compilers that the jobs market is weakening. Then there is full-time employment. It has been negative year-on-year for eight consecutive months. The fall in full-time jobs leads to question marks about the quality of jobs being created.
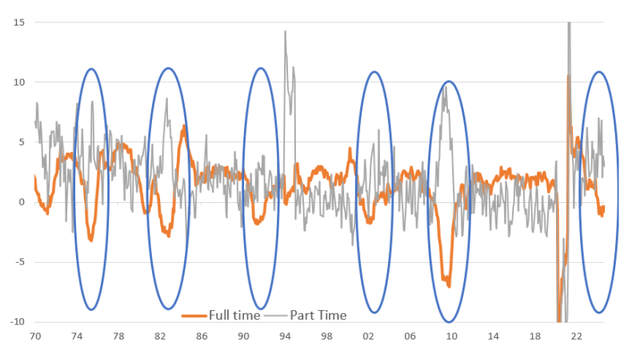
Falling full-time jobs (orange line above) signal a weakening jobs market
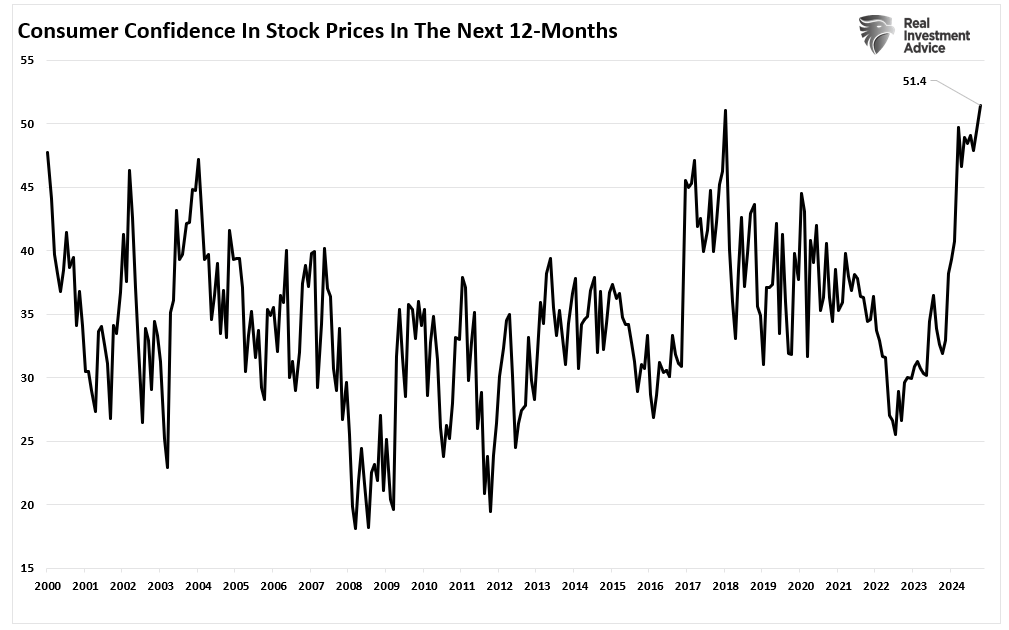
Still, inflation expectations are rising at least in part because of the strong(?) jobs report. The 10-year breakeven has risen to 2.23% from 2.02% on September 10th. The 5-year breakeven has climbed to 2.14% from 1.86% on September 10th. The possibility of a half point cut in November is now zero. The CME FedWatch tool shows a 97.4% chance of a quarter-point cut instead. There is even a small possibility of no cut being priced into the market. The futures market is expecting a quarter-point cut in November and another in December. It is forecasting a funds rate between 3.00% and 3.75% as 75.1% likely by year-end 2025 (see chart below). The futures market had priced in the likelihood of a funds rate between 2.50% and 3.25% as 73.2% likely as of last week.
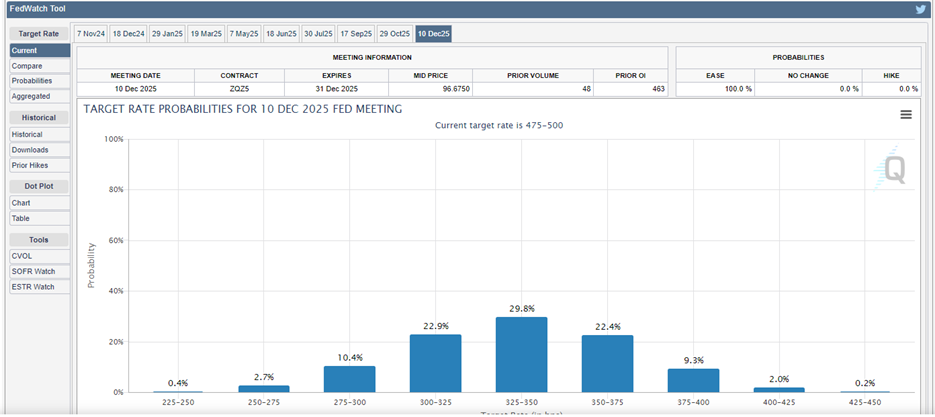
A funds rate of 3.25% to 3.50% translates to a 10-year Treasury yield of between 4.25% and 5.50% given a normal 1% to 2% spread. (see chart below).

It appears as if the 10-year Treasury yield is likely to continue backing up in the coming quarters. A move back above 4% shouldn’t come as a surprise should it happen. A 10-year yield at 4% or more isn’t good news for the 30-year fixed mortgage rate. Higher than expected longer-term rates might also put a crimp in corporate earnings.
Meanwhile, a funds rate of 3.25% to 3.5% seems about right for a neutral rate. (The neutral rate is the funds rate that neither stimulates nor restricts the economy). Inflation of 2% with a funds rate of 3.38% means a neutral rate of 1.38%, a reasonable estimate. The Fed’s dot plot implies a neutral rate of 0.9% by 2026. The dot plot has inflation at 2% and the funds rate at 2.9% by then. An inflation rate of 2% puts the 10-year Treasury at 3% to 4%, assuming a real yield of 1% to 2%.
A terminal funds rate of 2.9% puts the 10-year Treasury at between 2.9% and 5.4%, assuming a 10-year Treasury minus funds rate of between 0% and 2.5%. (see chart below).
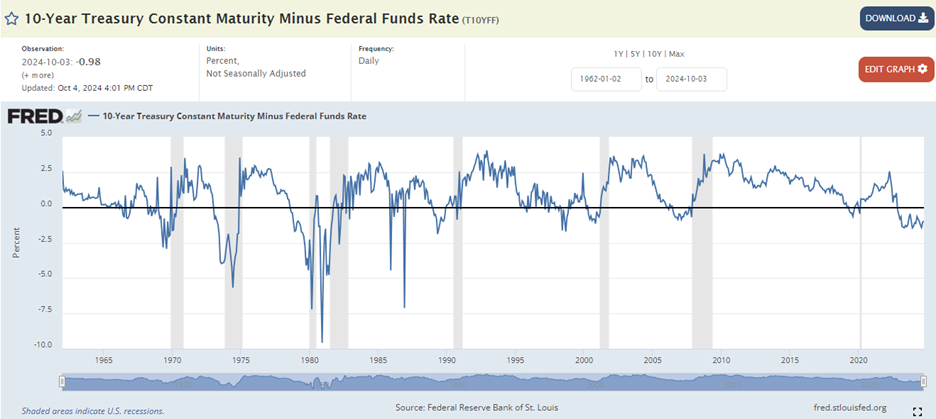
It's a wide range for the 10-year of between 2.9% and 5.4%. An economy growing more than 2% would argue for a 10-year Treasury toward the higher end of the range. It's uncertain whether the heavily indebted U.S. economy can grow faster than 2% with a 10-year yield north of 4%. We will have to see over the next year or two.
It also remains to be seen if inflation will continue to decline. There is a growing risk that inflation will reverse higher in 2025. At least one Fed governor is concerned about exactly that happening.
Uncertainty remains higher than normal and risk management remains a priority.
Economic Indicators
The jobs report was the big news last week. Nonfarm payrolls increased by 254,000 in September up from 159,000 the prior month. The prior two months' reports were revised up by 72,000. Unemployment fell to 4.1% down from 4.2%. Hourly wages rose by 0.4% in September. They rose 4.0% year-over-year. All in all, a strong report. Initial jobless claims rose to 225,000 from 219,000 the prior week.
The ISM manufacturing report continued to show contraction in manufacturing. The September number was 47.2%, the same as the prior month. The ISM services number hit an 18-month high. It climbed to 54.9% from 51.5%. The business activity index climbed to 59.9%, 6.6% higher than August. New Orders rose to 59.4% from 53.0%. The employment index did contract 2.1% to 48.1% though.
Last week’s economic data was almost uniformly strong. The Fed’s half-point cut is looking increasingly like overkill. The likelihood of a soft-landing looks increasingly possible. Norwood Economics has been forecasting a recession later this year or early next. There is scant evidence of a recession approaching in the next few quarters. We may have to change our base case to soft landing. No recession means an accelerating economy and reversal in the inflation trend is an increasing tail risk though.
Real Interest Rates and the 30-Year Fixed Mortgage
Real interest rates are the real cost of money. The nominal rate is the interest rate you pay the bank. The real rate is the nominal rate minus inflation. Real rates of return are what increase your purchasing power. The real interest rate and real stock market return are what count.
A 401k participant I talked with last week recently refinanced a 30-year mortgage at 5.99%. He wanted to know if he’d gotten a good rate.
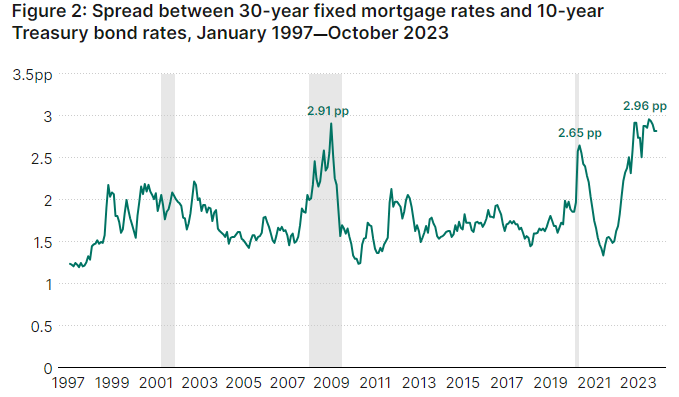
The 10-year Treasury yield is 3.97% as of Friday. A spread of 1.5% to 2% between the 30-year fixed and the 10-year Treasury is normal. Spreads moved higher during the housing crisis. They rose again during Covid and yet again when the Fed started hiking rates in 2022. The 401k participant’s rate of 5.99% was close to the long-run spread between the two rates (see the chart below).
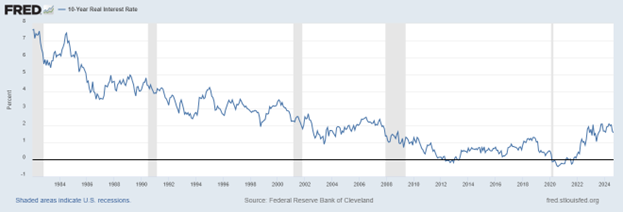
Drilling down further, the 10-year Real Interest Rate is higher than during most of the 2010s. Money was astonishingly cheap during most of that decade.

The real 10-year rate has been falling for most of the period since 1982. The real 10-year rate was over 7% back then. The real rate spent most of the 1990s between 2% and 4%. It spent most of the period from 2000 until the Great Recession between 1% and 3.0%. The real 10-year rate is 1.59% currently.
Money is still cheap. The 401k participant should be fine with a 6% mortgage rate and a real interest rate of around 3.5%. (Subtract 2.5% inflation from the 5.99% mortgage rate).
Regards,
Christopher R Norwood, CFA
Chief Market Strategist