Inflation is not likely to fall to 2% any time soon

Market Update
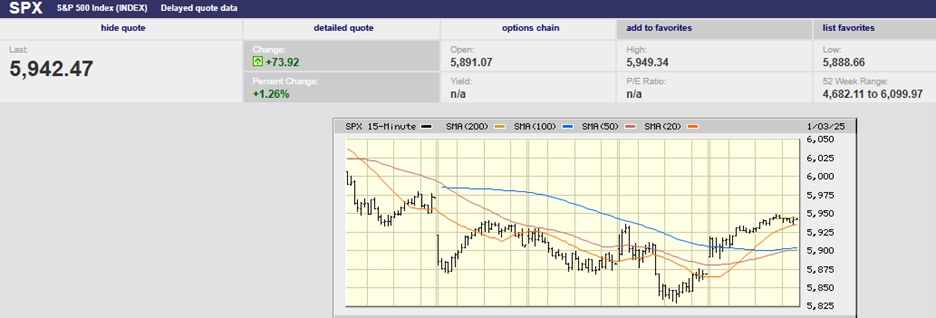
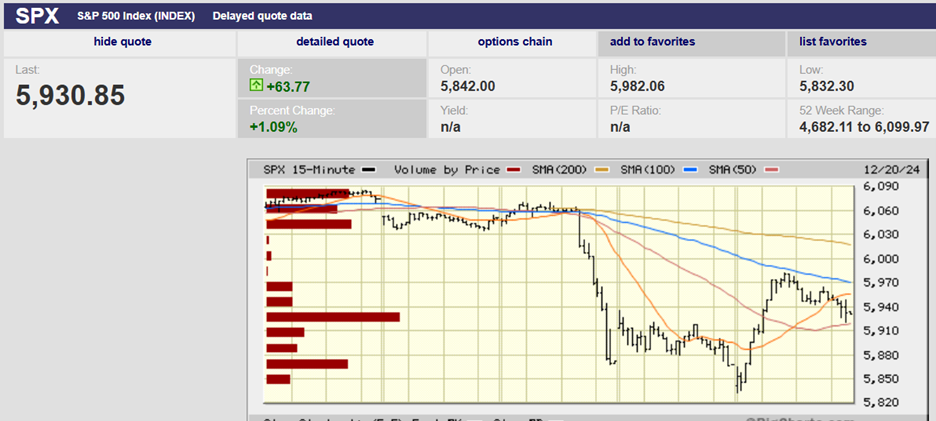
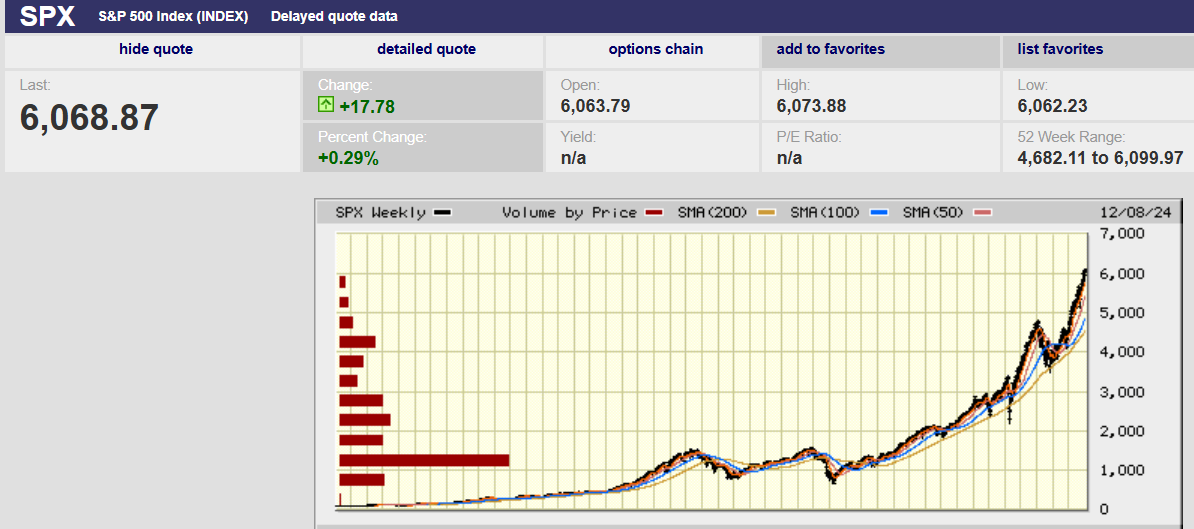
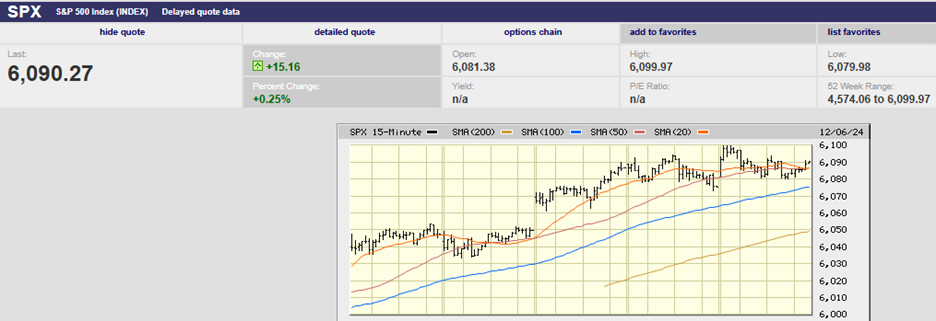
The S&P 500 lost 3.4% last week and closed at 3934.38. The Nasdaq fell 4%. The S&P failed at the upper end of the trading channel December 1st, selling off the next three trading days. The 100-day moving average has provided support. The index penetrated the 100-day Tuesday and Wednesday but closed above both days. It bottomed at the 100-day Thursday and Friday. Based on technicals, we should get another run at the upper end of the trading channel this week or next. However, there are times when fundamentals take over and drive short-term direction. This week fundamentals will rule.
The CPI number is due Tuesday. The Fed meets Wednesday. Those two events will determine near-term direction, not technicals. A higher-than-expected CPI will likely cause a sell-off. A more hawkish than expected Fed announcement will also cause a sell-off. A lower-than-expected CPI reading will send the S&P higher. Longer term the odds favor the downside. Stock markets fall when the Fed is raising rates. Markets continue to fall even after the Fed stops raising rates. Investors seem to have forgotten that fact.
Markets don’t start rising until the Federal Reserve is well into a new easing cycle. The current yield curve is screaming a warning as well. Investors aren’t listening yet. The 10Yr/3Mth curve is negative 0.74 as of Friday. It reached negative 83 bps on 2 December. The yield curve has only been that inverted three times in the last 60 years. Those times were in 2000, 1979-82, and 1974. A 60 bp inversion occurred in February 2007. The economy experienced recessions in 2001, 1980, 1981-82, 1973-75, and 2007-2009.
The four steep yield curve inversions preceded recessions. They also preceded some of the deepest bear markets of the last 50 years. Importantly, stocks underperformed government bonds AFTER the Federal Reserve had paused. They underperformed by between 32% and 65%, according to Absolute Strategy Research. Investors shouldn't expect stocks to rise when the Fed stops hiking. History doesn't support that view.
Economic Indicators
The economic data out last week was positive for the most part. One negative was that the producer price index for final demand was higher than expected. It was 0.3% for November the same as in October. Economists had forecast a drop to 0.2%. The index is up 7.4% year-over-year. Services were the big contributor and services inflation is proving stickier than anticipated. Gains for September and October were revised higher. PPI inflation feeds into the CPI. It can also cause margin compression, impacting earnings.
The housing market is showing signs of cracking. The decline in home sales is the fastest since at least the mid-1970s, according to Macro Alf. Housing affordability has fallen during the latest surge in housing prices. The median housing payment has risen to 46% of median household income. It was 42% at the last housing bubble peak, according to the Fed. Home prices fell 26% after the 2006 housing bubble peak. Median housing payments reached 26.7% of median household income after the 26% decline. Median housing payments remained below 33% of median household income until the sharp rise in home prices in the last few years. The real estate market is likely to show more signs of stress in the coming quarters.
Muted Stock Market Returns
Creating a financial plan that depends on 9% to 10% returns for stocks is likely to lead to shortfalls for retirees. The U.S. stock market is not priced for returns in line with long-run performance. There are many different valuation metrics correlated to 10-year returns. Market Cap to GDP is Warren Buffets' favorite. Others include replacement value, price-to-sales, price-to-book, and CAPE (10-year cyclically adjusted price-to-earnings).
Currently, valuation metrics are pointing to 10-year returns of between 4% and 7%. It isn’t horrible to earn 5.5% (mid-point of the range) on average annually over the coming decade. It can cause your financial plan problems though if you’re counting on the extra 3.5% to 4.5% to meet your spending goals. Your spending shortfall may be even larger once higher-than-expected inflation is factored in.
Inflation is likely to run hotter over the next 10 years than the last 10 years. It is increasingly likely that it will take two business cycles or more to bring inflation back to the 2% level. NY Fed President John Williams acknowledged as much recently. He pointed out in a speech that inflation may remain elevated until 2025. And it may well remain elevated even longer if the Fed isn’t willing to raise the funds rate much above 5%.
Real interest rates are the real cost of money. The real rate is the nominal rate (the rate you pay or are paid) minus the inflation rate. Real rates are normally positive to the tune of 1% to 2%. The Fed needs to raise the funds rate to 7% to 8% to normalize the real interest rate. At no time in history has inflation dropped significantly with real rates still negative. The fed-funds rate is 3.75% to 4.00% and likely to rise by 0.5% this week. A fed-funds rate of 4.25% to 4.5% with inflation running well over 5% doesn’t seem like a recipe for 2% inflation anytime soon.
Many retirees will fall short of their spending goals if they only earn a 1.5% real return over the next decade. Most retirees don't put 100% of their portfolio in stocks either. A 60/40 stock and bond portfolio is likely to earn only 3% to 4%. Many retirees will not earn enough to offset 4% inflation over the next decade. It could force them to make changes to their spending goals in retirement. An unhappy prospect for retirees hoping to enjoy their sunset years.
Regards,
Christopher R Norwood, CFA
Chief Market Strategist
