Understanding the investing environment is important

Market Update:
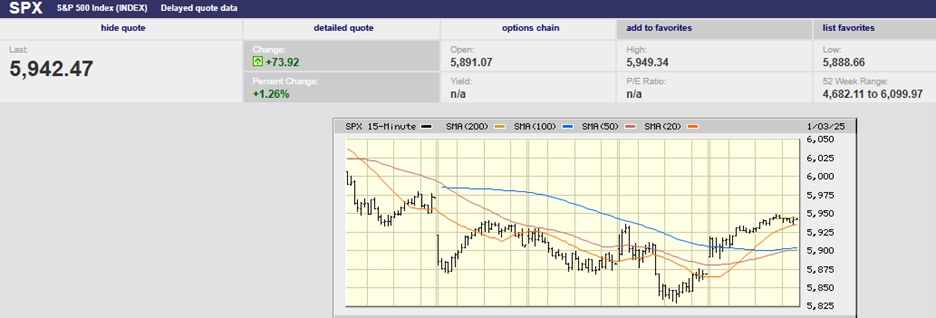
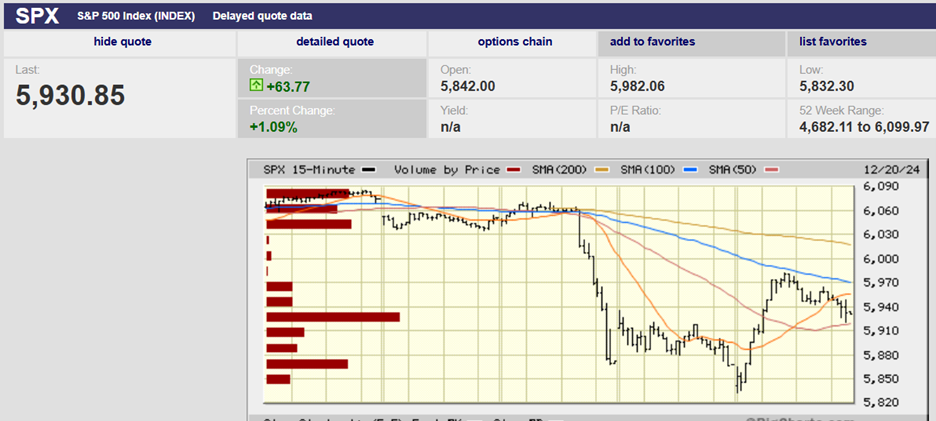
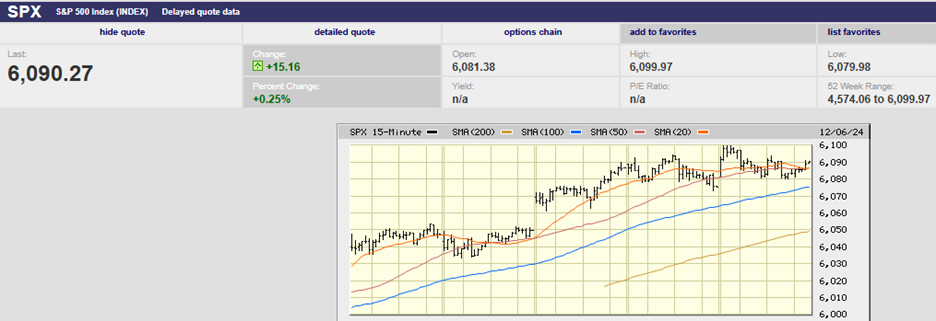
The S&P 500 fell 2.2% last week to close at 4357.04. The index lost 4.65% in September, its worst September since 2011. The S&P was up 0.58% in the third quarter and is up 15.92% on the year. The short-term trend is down though. The S&P hit 4288.52 Friday before bouncing, but that low confirmed the downtrend. The S&P is more likely to move down than up over the next few weeks now that a lower high and lower low are in place. The 20-day moving average falling below the 50-day signals short-term weakness. The next downside target is support at 4233.13, the July 19th low. The index needs to move above 4465.4 to negate the short-term downtrend. The trend is still up longer-term. The rising 200-day moving average is at 4140.
The 10-year Treasury yield rose again last week to 1.54%. It is the highest yield since June. Bonds have struggled in 2021. The Bloomberg Barclays Aggregate index returned 0.05% in September. It lost 0.87% in the third quarter and is down 1.55% year-to-date. The outlook for bonds is negative over the next few years. A looming rate hike cycle will pressure bond prices. Bonds will struggle longer term as well if interest rates move back to more typical levels. The 10-year Treasury’s long-run average yield is around 6.5%. The 10-year has a duration of approximately 9%. A 1% rise in yield will cause the bond price to fall 9%. The iShares 20+ Treasury Bond ETF (TLT) has a duration of 19%. A move from 1.82% to 2.82% for TLT means a drop of 19% in price. Bonds are a risky investment going forward.
Meanwhile, the economy is slowing. Growth of mid-6% is giving way to forecasts of 3% or lower for Q3. Consumer spending has been flat since spring. Personal consumption expenditures in August were almost unchanged from April. Joshua Shapiro, chief U.S. economist at MFR thinks third-quarter GDP growth could be around 3%. Second-quarter GDP growth was 6.7%. The Atlanta Fed’s GDPNow forecast is for 2.3% Q3 growth, with consumer spending growing at a 1.4% annual rate. Slowing economic growth means slowing earnings growth. Earnings forecasts will come down if the economy continues to slow into 2022. Growth of 2.0% to 2.5% in 2022 is not baked into forecasts.
Economic Update:
Core capital goods orders in August were up 1.8% after rising 0.5% the month prior. The Case-Shiller home price index rose 19.7% in July. It was up 18.7% in June. Pending home sales rose 8.1% in August up from a drop of 1.8% in July. The strong housing market is a positive for the economy. Consumer confidence fell to 109.3 in September from 115.2 in August. It is a seven-month low. Dropping consumer confidence suggests consumers are likely to curtail spending going forward, according to Lynn Franco, senior director of economic indicators at the Conference Board.
The Chicago PMI came in at a strong 64.7 in September although it was down from an even stronger 66.8 in August. Nominal personal income was only up 0.2% in August compared to 1.1% in July. Real disposable income fell 0.3% in August after rising 0.7% in July. Real consumer spending rose 0.4% in August after declining 0.5% in July. Consumer spending will likely stay subdued through year-end due to the drop in real disposable income and consumer confidence. Expect Q3 GDP growth of 2.5% and Q4 GDP growth between 2.0% and 2.5%.
Listening to the Market:
The stock market is a market of stocks. The market has 11 sectors and 69 industries represented. There are thousands of companies. Investors are always assessing which sectors, industries, and companies will provide the highest return. Information is interpreted and buying or selling pressure shifts. Sometimes advances are broad and sometimes narrow. It pays to listen to what the stock market is telling us.
It is the reason we spend so much time analyzing the weekly market data. It helps us understand what the market is likely to do and what it isn’t likely to do. Paying attention to valuation helps us judge risk as well. Tracking the economy along with the stock market helps us understand whether pullbacks are likely. It also helps us gauge whether those pullbacks will be short and shallow or long and deep. We have been warning that the stock market is expensive for over a year. We have also been cautioning that a correction is overdue for over a year. It is possible a correction is now in progress. It is also possible it isn’t. Predicting exactly when a pullback is going to occur isn’t the point of the exercise. Rather, understanding the investing environment helps us judge how much risk we can prudently take with our client’s money.
Norwood Economics made substantial investments in energy stocks last October. Those seven stocks are up far more than the market since. It was a wonderful opportunity to overweight one sector of the stock market. We were willing to make the large energy sector investment because we understood the economic environment. We also understood the stock market environment. Our understanding of the situation last October allowed us to make a very successful active management decision. And that is the whole point of tracking the economic data and analyzing the stock market in such detail on a weekly basis.
Regards,
Christopher R Norwood, CFA
Chief Market Strategist
