Gross Domestic Income indicates economic weakness.
Market Update
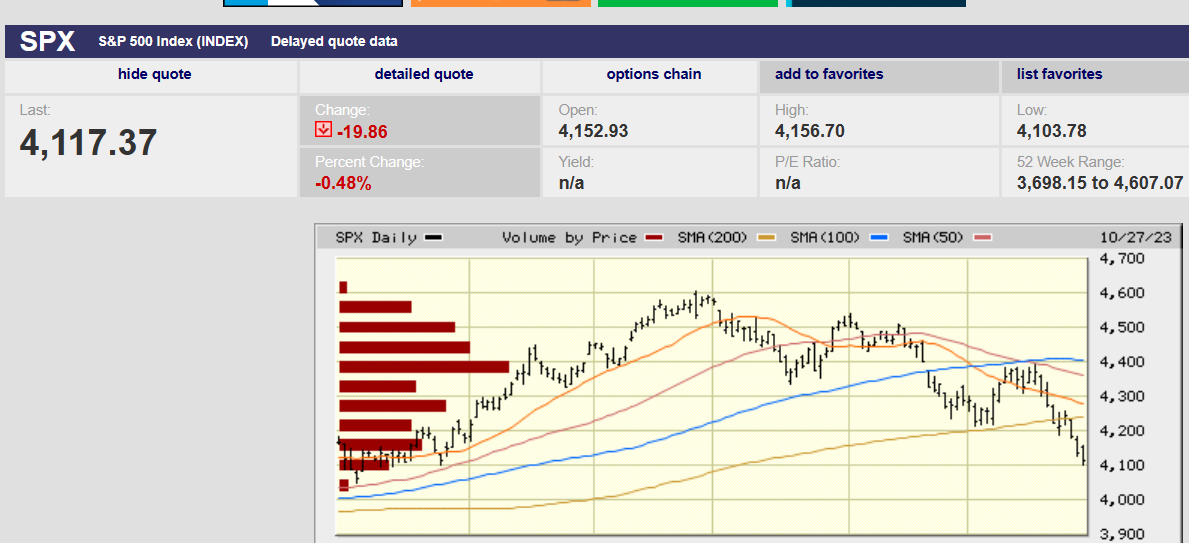
The S&P 500 fell 2.5% last week to finish at 4,117.37. The Nasdaq fell 2.6%. Both are down over 10% since their July highs. The S&P is up 7.2% on the year. It is down 14.5% since hitting its all-time high of 4818.62 on 4 January 2022.
The equally weighted S&P (RSP) is down 5.2% on the year and down 14.4% since 27 July. The stock market is in a bear market and will continue to be until it rises above 4818.62. For now, the short-term trend is still down.
The market has traded sideways for the last couple of years and people are starting to notice. I had several 401k plan participants mention it last week for instance. The mood is changing. The first half of the year was strong, helping investors forget about 2022. Now they are remembering as the green shoots of spring fade into autumn.
The S&P attempted to take back the 200-day moving average last week at 4,240. It hit the low for the day of 4,189.22 in the first 30 minutes of trading on Monday before reversing higher. The index hit its high for the day of 4,255.84 by 1 p.m. It couldn’t remain above the 200-day though, closing at 4,217.04. The 4,215-4,225 area has served as support since early October. The S&P has hit intraday lows of 4,216.45, 4,220.48, 4,225.91, 4,219.55, 4,223.03, and 4,219.43 since 3 October.
The repetitive lows in the same area make that area resistance now. The S&P attempted to retake the 200-day again on Tuesday, rising to 4,259.38 in the morning. There it ran into selling, falling to 4,219.43, the heart of support. It made another run at the 200-day in late trading, this time successful. The market couldn’t maintain the 200-day the next morning though. The index gapped down below it at the open Wednesday as sellers came out in force. It is a sign of weakness that the S&P couldn’t hold above the 200-day yet again. Sellers controlled the market the rest of the week. Two failures to remain above the 200-day was an invitation to sell. The low for the week was reached in the last 30 minutes of trading on Friday.
The S&P is likely to trade down in the coming week given the trading action last week. The 200-day is now resistance. The trend since 27 July is down with the S&P confirming its lower low last week. The index is approaching oversold but isn’t quite there yet. On Balance Volume is in a nosedive, investors are starting to run for the exits. The VIX hit 23.08 on Monday, well shy of the level needed to put in more than a temporary low. We’ll need to see a VIX above 30 before a durable bottom can be put in place. The VIX closed the week at 21.27 despite the terrible market action the last three trading days. There is no sign of panic selling yet.
Notice I haven’t referred to fundamentals at all while writing about last week’s trading. That’s because fundamentals usually don’t matter much in the short term, only the long term. Last week’s trading was entirely mechanical. Computers trading based on algorithms. The big tech earnings reports last week were nothing more than Rorschach tests. Amazon, Microsoft, Alphabet (Google), and Meta (Facebook) all reported. None of the reports were bad.
Despite a solid report, the fear surrounding Google’s slowing cloud growth sunk the stock. But only because investors chose to focus on the cloud business. Investors decided to ignore the many positive aspects of the report. It reminds me of a line in a movie from the America President (Michael Douglas and Annette Bening). The PhD in data analytics responded to the President’s question with, “basically the country has moods”. Right now, the mood among investors is growing bearish. Investors are seeing calamity in the Rorschach test. Barring some jolt of major positive news, the stock market will continue to decline for now. Expect an oversold bounce soon though, perhaps even this week. Any bounce is unlikely to take us above 4,200 and even less likely to clear the 200-day moving average at 4,240.
Uncertainty is high and risk management remains a priority
Economic Indicators
The U.S. economy grew by 4.9% in the third quarter. The report was stronger than the 4.5% consensus among economists. The economy accelerated from the second quarter’s 2.1% growth rate. More than half the growth came from consumer spending. The government chipped in 0.8% of the 4.9% growth. Inventory build accounted for 1.3% which means real final sales weren’t as strong. Still, 3.6% real final sales is above trend. Many economists are expecting a much lower number for Q4. Steven Blitz, chief U.S. economist for TS Lombard is forecasting 1.5% for instance. He doesn’t see inventory build contributing as much. He expects the fiscal spending will moderate. Blitz also expects the Fed’s rate hikes to assert a growing drag on consumer and business spending.
Consumer spending is already outrunning personal income. Personal income for September rose 0.3% while personal spending rose 0.7%. Credit card balances are rising, as are delinquencies. Consumers won’t be able to spend out of savings long-term. The Covid money should have run out by now, according to the San Francisco Fed. And then there is the restart of student loan repayments. Student loans amount to $1.57 trillion, an anchor around consumers' necks.
A slowing economy is needed to tame inflation. The Personal Consumption Expenditure index (PCE) rose 0.4% in September. Core PCE (excluding food and energy) rose 0.3% (3.6% on an annualized basis). The core PCE year-over-year rose at a 3.7% rate, well above the Fed’s 2% target. The hot PCE report could lead to more selling on Monday. The combination of strong PCE and GDP reports means more pressure on long-term interest rates as well.
It's possible the Fed is done raising rates. The Fed funds futures market is all but guaranteeing the Fed won't raise the Fed funds rates this week. The CME FedWatch Tool shows a 99.9% probability of no change. What may move the market is Fed guidance.
The December meeting isn’t currently in play. The CME FedWatch Tool shows an 80.1% probability of no change for December. The stock and bond markets will react if the Fed indicates this week that a hike in December is possible.
Investors will also be looking for guidance about rate cuts next year. Currently, the FedWatch Tool is indicating the first cut at the May or June meeting. Long-bond rates will probably rise further if the Fed indicates no cuts until later in 2024 or even 2025. Rising long-bond rates in turn will put more pressure on stocks.
History tells us to expect more rate hikes from the Federal Reserve based on high nominal GDP growth. Nominal GDP grew at an 8.5% annualized pace last quarter. (Nominal GDP includes inflation. The GDP price deflator is currently 3.6%. Real growth of 4.9% plus inflation of 3.6% gives you 8.5% annualized nominal growth.)
Nominal GDP grew at a 6.3% annual rate year-over-year. Nominal GDP is growing at the fastest rate since the mid-1980s, according to Joseph Carson, former chief economist for AllianceBernstein. He writes that “history shows it takes a fed-funds rate equal to or above nominal GDP to slow the economy.” The current Fed funds rate is still 0.75% below the year-over-year nominal GDP rate of 6.3%. “By contrast, interest rates in the inflationary period from the late 1960s through the 1970s were kept below nominal GDP,” writes Martin Barnes in the November Bank Credit Analyst report.
Translation: a fed funds rate below nominal GDP won't slow the economy enough. It also means inflation above the 2% Fed target.
Norwood Economics is forecasting a recession for next year. It is possible we’ll get one even as inflation remains well above 3.0%.
On The Other Hand
Hoisington Investment Management is an Austin Texas Registered Investment Advisor that manages $3 billion for pension and profit-sharing plans for governments and corporations. Hoisington invests only in U.S. Treasuries. It writes a quarterly report that is heavy on economics. Dr. Lacy Hunt assumes his readership has a background in economics.
Hoisington believes a recession is coming. We may already be in a recession as a matter of fact. It also believes that inflation will fall to 2% or lower during the completion of the business cycle. Dr. Hunt writes that, “As measured by bank credit, the commercial banking sector has already been in recession for more than a year.” He further writes that, “When the recession brings on an even more significant advance of bankruptcies and delinquencies than has already occurred, banks will tighten credit standards even further.”
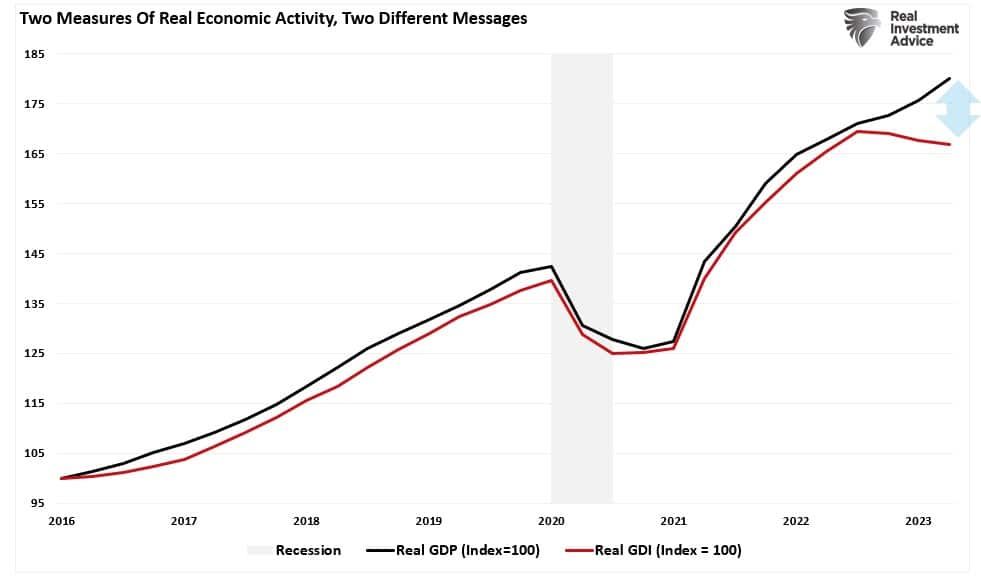
Hunt also points to Gross Domestic Income (GDI) as indicating that the economy is far weaker than generally believed. GDP and GDI must equal one another since expenses and income must equal one another. Every purchase has an offsetting sale. Dr. Hunt points out that, “In the past three quarters, real GDI declined at a 0.6% annual rate while real GDP gained at a 2.3% pace, with the average of the two being just 0.8%.” He further notes that, “monetary and fiscal restraint intensified during this span, suggesting that revisions are more likely to take the results lower rather than higher.” And in fact, it is the norm that the start of recessions is missed because of faulty data. Most of the inputs to the initial GDP number are estimates. Those estimates are mostly reliable until the economy experiences a turning point. Estimates are often wildly inaccurate when recessions both begin and end. Then there is the fact that when GDI and GDP diverge it is usually GDI that proves more accurate.
The last sentence of the Hoisington quarterly report is worth noting. “This environment will be favorable for lower Treasury bond yields.”
Norwood Economics agrees. Long-term Treasuries have been a disaster for much of the last three years. The asset class is growing attractive.
(NORWOOD ECONOMICS IS NOT MAKING A RECOMMENDATION)
Regards,
Christopher R Norwood, CFA
Chief Market Strategist