Inflation stalled.
Payrolls number solid.

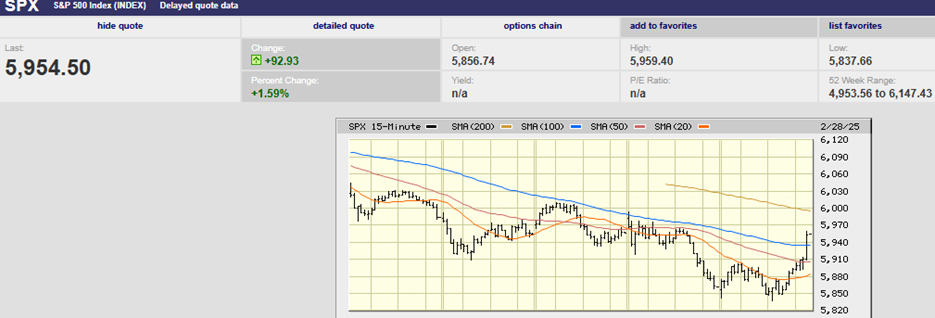
5-day S&P 500 chart
Market Update
The S&P 500 rose 0.5% to 5,127.79 last week. We expected the index to continue its decline and it did, at least until it found a bottom on Thursday. The index began a recovery around 10:15 Thursday morning. The recovery continued Friday. The favorable payroll number on Friday led to a gap up open and a gain of 1.3% on the day. The S&P might have logged a loss on the week without the positive reaction to the payroll number. It’s debatable whether the payroll number was worthy of the big move on Friday though. It’s debatable if the payroll number was the reason for the big move for that matter. More on that below.
The coming week is a toss-up. The S&P might succeed in besting the 50-day. A move above the 50-day clears the way to a new all-time high. Or the index might fail at the 50-day and resume its pullback. The Federal Reserve meeting is in the rear-view mirror. Monetary policy is off the table for a while. Earnings season is about halfway done. Earnings season, especially C-suite guidance, will determine the market’s direction over the next few weeks. Give market momentum and loose financial conditions the edge. Expect an up week this week. It’s a close call though.
Earnings estimates for Q1 are still coming down. We wrote last week that earnings were expected to grow 3.2% in Q1. The consensus estimate is now 2.5%. The S&P is expected to see a 6% decline in earnings in Q1, excluding the “Magnificent Seven”, according to Scott Black, president of Delphi Management. Black is also a member of Barron’s annual RoundTable. The lack of earnings growth for most of the companies in the S&P is a problem. Black also told Barron’s that, “It’s Pollyannaish to think there will be rate cuts this year. There is no reason to think that the market will go up from here. Valuations are pretty full, and I don’t see interest rates coming down. Current estimates for earnings growth aren’t realistic.”

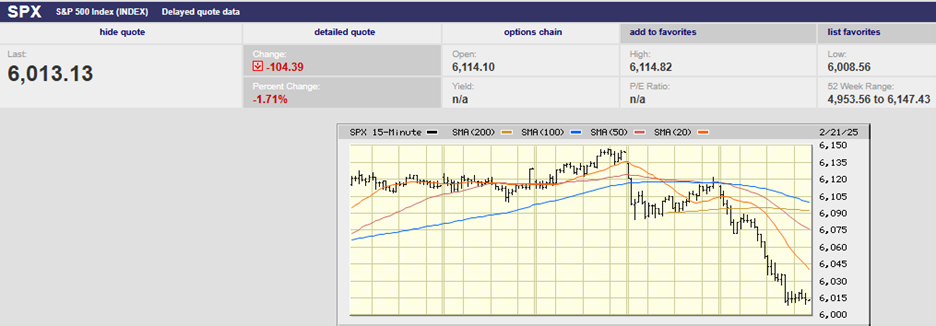
1-year S&P 500 chart
We wrote last week that the big round number 5,000 was support. The market closed at 5018.39 on Wednesday. It hit a low of 5011.05 on Thursday before beginning to rally. It looks as if 5,000 will hold for now. The 100-day is right below the big round number. To the upside the 50-day is resistance. The S&P poked its head above the 50-day for a time on Friday. It closed below the moving average though. The 50-day is near 5,130. “If it can’t breach 5130, “that’s not a good thing,” says Matthew Tuttle of Tuttle Capital Management. “There are a lot of money managers that have hard and fast rules—they will not buy the market under the 50-day.”
Mechanical trading was seen again last week. The S&P 500 dropped more than 0.6% during the last 10 minutes of trading both Tuesday and Wednesday. Wall Street lore says that smart money trades in the last hour of trading. The back-to-back sharp declines in the last 10 minutes of trading might be a signal. It also might be noise. Still, it doesn’t happen often. The last time it occurred was in February 2018, according to Barron’s. It has happened 10 times since 1985. The index was down an average of 28% when the previous nine last minute sell offs occurred. It might be nothing, but it pays to note unusual occurrences in the market. They often signal trouble ahead.
Now to the payroll number that wasn’t weak. The Bureau of Labor Statistics (BLS) reported a 175,000 rise in nonfarm payrolls in April. The gains would be considered solid in most months, according to Barron’s. What made it appear weak was that economists’ consensus estimate was for 240,000 new jobs. That forecast was the highest in a year.
Economists estimate that the U.S. need only create between 60,000 and 100,000 jobs monthly to keep up with population growth. Creation of 175,000 jobs means the jobs market is strong. It also means there is still a labor shortage. A labor shortage leads to higher wages. That in turn supports higher for longer interest rates. Traders could've used the jobs report as an excuse to sell the market.
It’s at least as likely that traders decided in advance of the jobs report that the 50-day was attainable. Trading is a zero-sum game. Traders attempting to push the market above resistance hope to spark more buying. More buying would lead to more profits for traders long the market. The jobs number may have provided the excuse, but it wasn't the cause. The cause was traders assessing that those on the other side of the trade were vulnerable to a push higher. Traders would've found another excuse to take a shot at the 50-day if the jobs report wasn't available. The hand-to-hand combat that is daily trading might see a reversal down in the S&P in the next day or two. Or the longs might sense they can push the index to a new 52-week high. Regardless, daily market movements have little to do with fundamentals.
(As an aside: the 90% confidence interval for the jobs report is 130,000. That means there is a 90% chance that the actual jobs number is in the range of 45,000 to 305,000. Go ahead and try to make sense of Friday's trading using the range as the fundamental data point).
Last week saw a second Fed funds rate cut back on the table, purportedly because of the jobs number. It also saw the Fed acknowledge that progress on the inflation front had stalled. Powell did take interest rate hikes off the table. (Something he may regret in the coming quarters if inflation data doesn’t start cooperating). Powell also continued to characterize monetary policy as tight. He seems to be basing that assessment on the real interest rate estimate. The 10-year Treasury closed the week at 4.51%. The Trimmed Mean PCE annual rate is 3.0%. The real interest rate based on those two numbers is 1.51%. The Fed believes that the neutral rate is 0.5%. The five-year breakeven rate is 2.35%. Using the breakeven rate the real rate is 2.16%, even more restrictive.
There are several problems with using an estimated neutral rate of 0.5% to gauge monetary policy tightness. First, the neutral rate is a guesstimate. There is no way a priori to know what rate will neither stimulate nor restrict economic growth. Second, as we pointed out a few months ago, Goldman Sachs believes the relationship between the Fed funds rate and GDP growth is broken. Goldman has created its own financial conditions index. It indicates that financial conditions are loose. Bloomberg has done the same and reached the same conclusion. The Fed’s own Financial Conditions Index shows loose financial conditions. Former Wells Fargo chief economist John Silvia wrote last week that contrary to commentaries, financial conditions as measured by the Fed’s own index are on the “easy side of neutral.”
Powell should focus on the financial conditions indexes instead of an unobservable neutral real rate. The probability of inflation rising is rising. Powell seems eager to cut. A Fed policy mistake is looming. The odds are it will cut too soon or not soon enough. The least likely scenario is that it will get monetary policy right. History tells us as much.
Uncertainty is high. Risk management remains a priority.
Economic Indicators
The employment cost index (ECI) came in high on Tuesday. The stock market sold off on the news. Wage increases are a sore spot with the Fed. It wants to see wage growth slow. The ECI came in at 1.2%, above the 1.0% forecast. It was also above the 0.9% increase in the prior quarter. Labor costs rose at the fastest pace in 18 months. Not helpful in the fight against inflation.
Also, initial jobless claims were low last week at 208,000, basically unchanged from the prior week's 207,000. U.S. productivity was weak in Q1, registering 0.3%, which was down from 3.2% the prior quarter. Unit labor costs rose 4.7% in Q1 up from 0.0% the prior quarter. Hourly wages rose 3.9% year-over-year down from 4.1% but still well above what’s needed to drop inflation to 2%.
Not to worry though. Shelter costs are coming down. They make up 36% of CPI. The CPI will fall as shelter costs fall. Shelter costs will continue to fall because real world prices have already fallen. Shelter costs fall with a lag. NY Fed President Bill Dudley says the lag is 6-12 months.
The problem?
Housing prices are rising. Home prices hit new all-time highs last month. The S&P Case-Shiller home price index rose 7.3% in February up from a 6.6% increase the month before. Home prices are rising because of limited supply. Rising home prices will likely feed into rising rental costs as people who can’t afford to buy are forced to rent. It is not obvious that shelter cost inflation will remain low once it’s caught up with real world prices. Rising housing prices may mean rising real-world rental costs. Rising real world rental costs would lead to rising shelter costs...with a lag of course.
The economic data out last week was not helpful to the Fed’s obvious desire to start cutting rates. Why is the Fed anxious to begin cutting? There are several possibilities. First, the banking system is stressed. Banks are sitting on around $600 billion in Treasury bond losses. The looming commercial real estate crisis will hit regional and community bank balance sheets hard as well. Second, the Federal government’s interest costs are ballooning. Interest costs were $659 billion in 2023. The CBO projects interest costs will total $870 billion in fiscal 2024 (ending in October 2024). Third, political pressure to cut rates is growing. It is an election year after all.
There is a growing chance that Powell and company will pull the trigger on cuts too soon. A Fed easing too early would make a no landing scenario and a resumption of inflation more likely. Bonds would suffer as interest rates rose. Stocks would suffer as well.
Big Money Poll
Barron’s Big Money Poll is out. Fifty-two percent of poll respondents said they were bullish about stocks for the next 12 months. The bullish faction made up 38% of Big Money managers last fall. Only 15% of Big Money managers were bearish, down from 24% last fall.
Big Money bulls are forecasting that the S&P will end the year at 5,461. It would be another 9% gain from current levels.
Only 15% of Big Money managers expect a recession in the next 12 months. The rest were evenly split between a soft landing and no landing. A no landing scenario means higher GDP growth, higher inflation, and higher interest rates than in a soft-landing scenario. Higher interest rates, all else equal, would mean lower earnings. Higher rates would also pressure stock price-to-earnings multiples. (That’s Norwood Economics talking not the Big Money managers).
Most Big Money managers said that the 10-year Treasury yield will end the year between 4.25% and 4.75%. The 10-year Treasury yield is 4.51% currently.
Big Money managers are evenly split on the election outcome. Nearly half of the Big Money managers believe that debt reduction should be the highest priority for policymakers.
A word of caution; Big Money managers aren’t any better than anyone else when making forecasts.
Regards,
Christopher R Norwood, CFA
Chief Market Strategist