- Chairman Powell Signals a Rate Cut in September
- The BLS Revised Down Job Growth by 818 thousand
- Goldman Sacs says BLS Revision Too Big
- Corporate Earnings Surprises Drop
- Caring for Elderly Parents a Growing Problem
Market Update/Economic Indicators
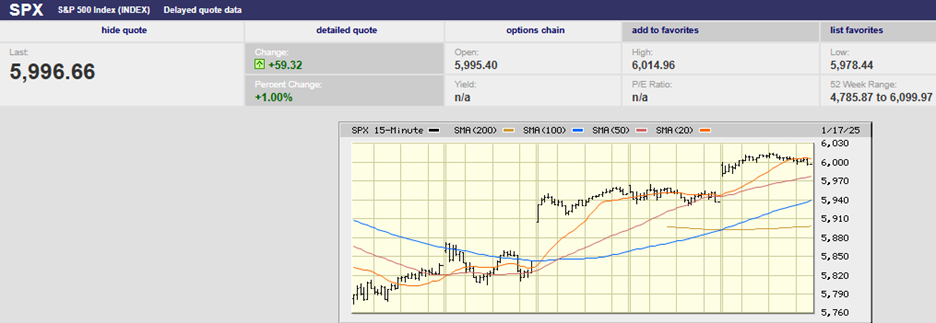
The S&P 500 rose 1.4% last week to close at 5,634.61. It continued its streak of higher lows the first three trading days of the week. The streak ended at 12 on Thursday. That many higher lows in a row is rare and indicates heavy buying interest. Markets that trend strongly tend to continue to trend. Burton Malkiel's "random walk" market isn't random. Momentum exists in markets because people have memories.
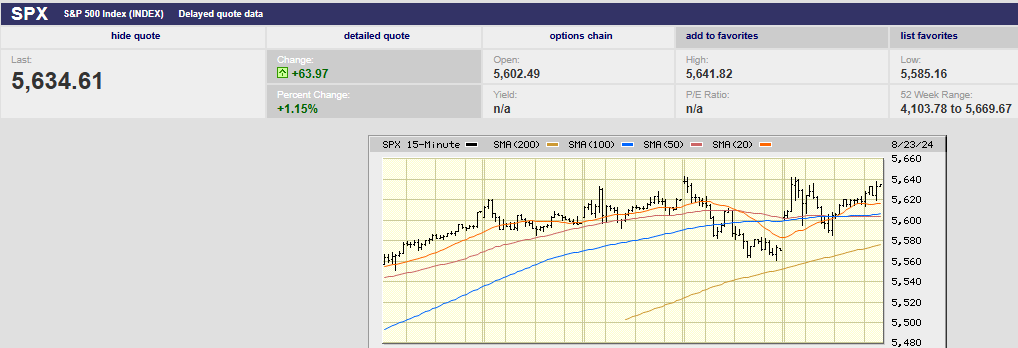
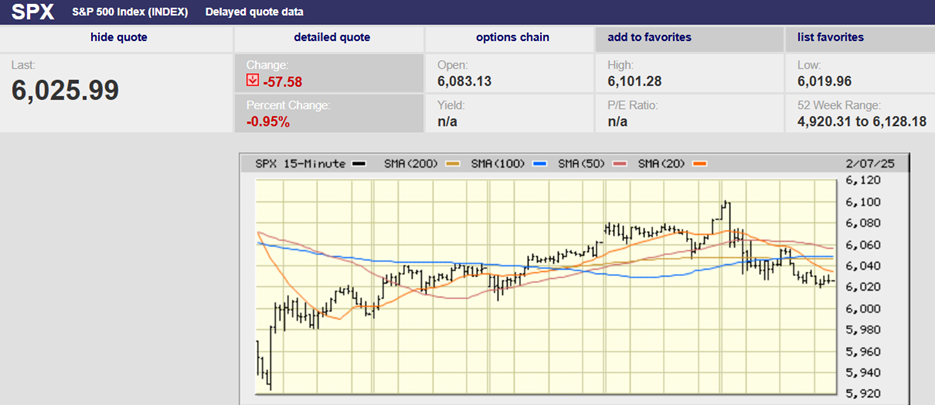
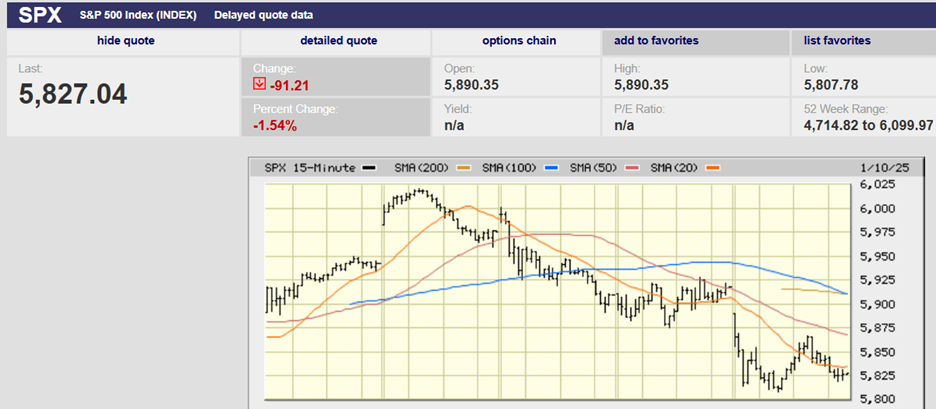
5-day S&P 500
Thursday the streak ended, and things got interesting. The market gapped up in the morning but ran into selling. The S&P hit its high for the day in the first minutes of trading. It peaked at 5,643.22 before starting to decline. The S&P fell to around 5,560 by 2 p.m. It hit its low for the day in the last half hour of trading. Thursday was an outside down day, a short-term negative, a warning that the rally is likely over for now. (An outside down day sees a higher high and a lower low from the prior trading day. It also has a higher open and lower close than the prior day) Outside down days don’t happen often and can signal a trend reversal.
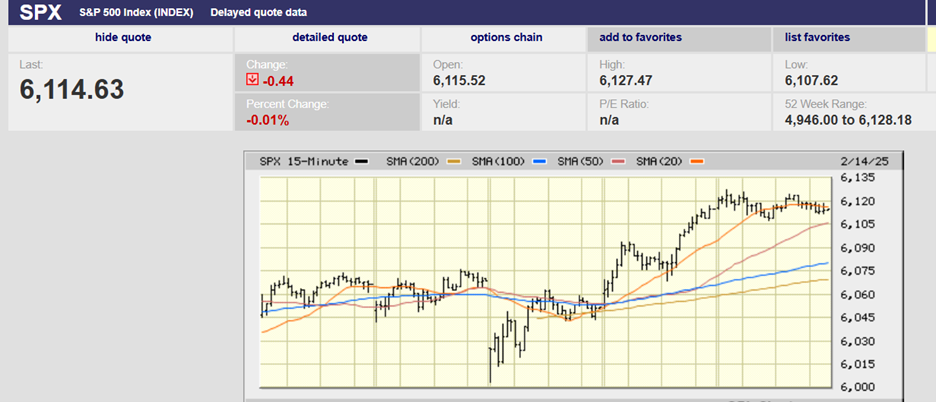
Traders attempted to salvage the rally with a gap up open on Friday morning. It doesn’t look as if it will work. (I’m writing this Friday afternoon. It’s 2:15 p.m.). The gap up open earlier today peaked a point shy of Thursday morning’s early high. Traders failed to push the index to a new high. Another short-term negative, if they can't take out Thursday's early high by the close today. The clock is ticking. No new high in the next hour likely means a sell-off into the close as traders start to take profits. Currently, the index has hit 5,620 for four fifteen-minute intervals in a row. Someone is selling at that level, capping the bounce that started at 12:45. It’s possible the derivatives market is driving the bus at the moment.
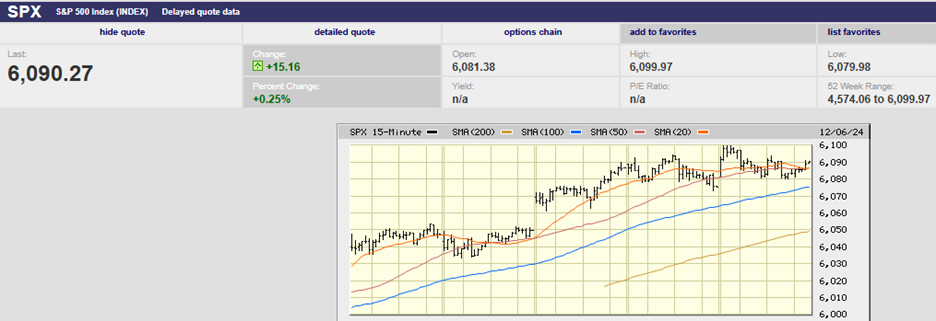
The S&P peaked at 5,669.67 on July 16th. That it is struggling at the 5,640 level is no surprise. Traders likely have sell orders resting below the 5,669 resistance level. The S&P is likely to see a down week next week regardless of whether the index sells off into the close today. Any pullback will also likely be the pause that refreshes. Market momentum is strong. The Fed has signaled it will cut in September. Right now, that is all that seems to matter to investors.
(A late update: the S&P traded sideways for 90 minutes, capped at 5,620. Buyers finally broke through and took a run at the day’s high of 5,641.82 hit in the first hour of trading. They fell a few points short of 5,640. Traders will likely try to open the market Monday on a gap up to clear resistance at 5,641.82 and 5,643.22. They’ll try to take out the 16 July high at 5,669.67 once they conquer Thursday's high. A failure to clear those levels in the next few trading days means selling later in the week.)

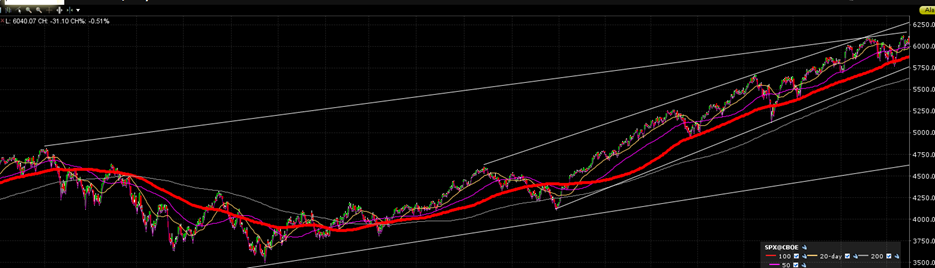
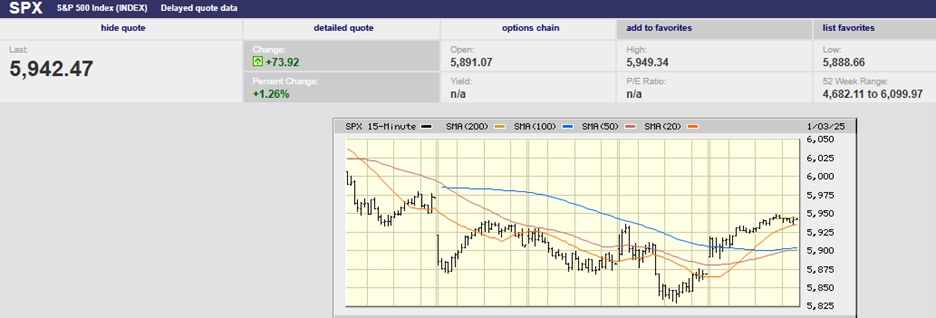
1-year S&P
That’s the technical picture. What’s going on with the fundamentals?
Fed Chairman Jay Powell’s Jackson Hole speech has folks excited. There’s lots of talk of a guaranteed rate cut in September. “The chairman said he is ready to lower interest rates, citing a cooling labor market and inflation closing in on the central bank’s 2% annual target,” Barron’s wrote. Powell’s speech mentioned labor conditions 27 times, according to Barron’s.
The futures market responded by reducing the odds of a quarter-point rate cut to 63.5%. The futures market raised the odds of a half-point cut to 36.5%. Yesterday the odds were 76.0% for a quarter-point cut and 24.0% for a half-point cut. The stock market was impressed with Powell's speech... for about 45 minutes. The index rose from around 5,600 to 5,642 and then stopped going up. Selling took it down to 5,585. It is starting to look as if investors priced in Powell’s dovish speech over the last 13 trading days. It might end up being a "sell the news" event as traders take some profits.
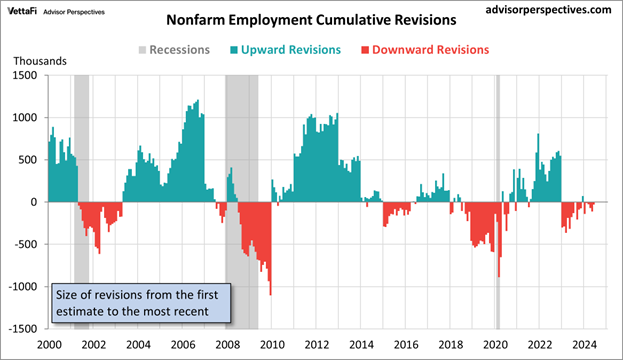
The other big fundamental data point last week was the jobs report revision. Turns out there were 818,000 fewer jobs created in the twelve-month period through March 2024. The Bureau of Labor Statistics (BLS) said that job growth was 30% less than the reported 2.9 million. The revision to the total payroll level of -0.5% is the largest since 2009.
There is one more revision in February. Following the first revision, job growth has averaged 174,000 monthly during the 12-month period ending in March. The initial estimate was for monthly job growth of 242,000 on average. Job growth of 174,000 on average is still strong. It isn’t the absolute number that is worrying investors. It is the rate of change and the fear that job growth will continue to decline. The thought of negative job growth has investors spooked.
Not to worry though. There is that second revision in February. Economists at Goldman Sachs said later Wednesday they think the BLS may have overstated the revisions by as much as half a million. “We think that today’s downward revision to payroll growth exaggerates the degree to which job growth has been overstated by about 500K,” Goldman Sachs chief economist Jan Hatzius said in a research note.
GS offered two reasons for its view. First the Quarterly Census of Employment and Wages (QCEW) program excludes many unauthorized immigrants who are not in the unemployment insurance system. GS believes many of them were correctly picked up in payrolls initially and will be added back eventually. The other reason is that the QCEW has tended to be revised up in recent years (suggesting a systematic undercounting in the initial report due to a process error).
“As a result, we think the true downward revision should be about 300k or 25k per month, which would imply that monthly job growth over this period was closer to 215K-220K than the initially reported 242k, but not as low as the 174k pace implied by the revisions,” Hatzius said.
Large revisions to the jobs report are common. It isn’t a conspiracy and doesn’t matter which party controls the Presidency.
Of course, one must wonder why the jobs report is considered an important data point for conducting monetary policy. Large revisions to lagging data would seem to make it useless.
Earnings growth is another fundamental percolating in the background. Earnings season is almost over. Q2 earnings growth was okay. The forecast is for 11.5% growth when all is said and done. Third-quarter earnings growth is expected to slow to 5.4% before picking up in Q4 to 12.8%. Why the slowdown and pick-up isn’t clear. The 2025 estimate of 15.2% earnings growth is optimistic. Revenue growth is fighting disinflationary headwinds. Margins are near regard highs already. Next year’s earnings estimate will come down, by how much is the question. Q4 earnings growth is unlikely to reach 11.5% for that matter.
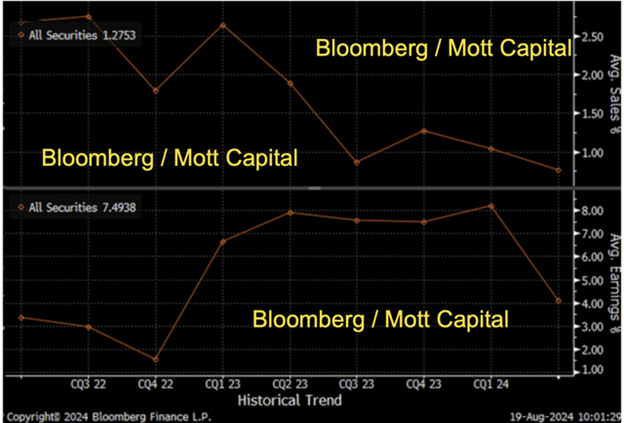
In fact, there is already evidence that revenue and earnings growth are trending negative. Earnings and sales surprises are down so far for Q2. The chart below shows aggregate sales and earnings surprises in Q2 for Nasdaq 100 companies. Eighty-two out of 100 companies have reported so far, according to Mott Capital. The aggregate sales surprise is 0.61% (top chart) and the aggregate earnings surprise was -0.91% (bottom chart). It was the weakest performance since late 2022.

Likewise surprises disappointed with the S&P 500. Four hundred and sixty four of 500 companies have reported, according to Mott Capital. The aggregate sales surprise was 0.77% and the aggregate earnings surprise was 4.1%. The weakest performance for both since the fourth quarter of 2022. (See the chart below).
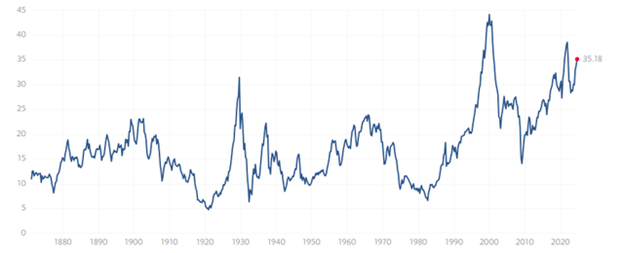
Continued pressure on revenue growth from slowing inflation will lead to earnings disappointments. The S&P is trading at 22x earnings, well above the long-term average of 16.5x. The chart below shows that the market is more expensive than any other time since 1871, other than in 2000 and 2021. The chart is based on price-to-earnings. The earnings number is 10-year trailing average earnings adjusted for inflation. It isn’t helpful for market timing (not much is) but does do a good job of forecasting 10-year market returns.
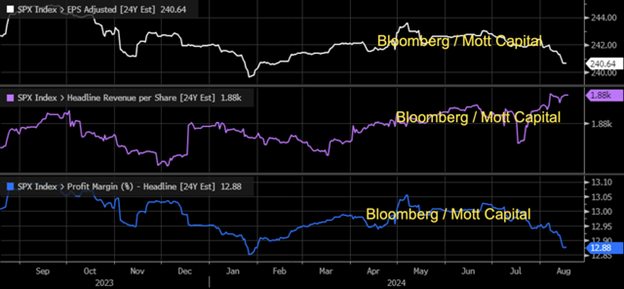
Downward earnings revisions are ongoing. The chart below shows S&P 500 annual earnings, revenues, and profit margin estimates for 2024. One can see that earnings and profit margin estimates are falling. Revenue estimates are rising slowly.
The Fed is going to cut in September, probably by 0.25%. The yield curve is going to un-invert and start to steepen. The history of the rate-cut cycle suggests that economic growth will continue to slow. The Conference Board is forecasting 0.6% GDP growth in Q3 and 1.0% GDP growth in Q4. It wouldn’t take much to push those numbers into negative territory.
Norwood Economics thinks a recession is in the cards for late 2024 or early 2025. The stock market has high odds of a pullback of at least 10% to 15% sometime in the next few quarters. A recession would lead to a 20% to 30% decline. We will use any pullback as a buying opportunity.
Uncertainty is high and risk management paramount.
Taking Care of Elderly Parents:
I’ve had several conversations with clients recently about their elderly parents. Baby boomers undersaved during their careers. Long-term care costs have skyrocketed in the last decade. More and more elderly parents are moving in with their adult children, or at least asking to move in. Adult children are often unable to provide the financial and emotional support needed to take care of elderly, ailing parents.
A few case studies might best illustrate the growing problem. I’ll start with my mom. Mom is in a senior living facility now. It was a struggle to get her to go but she was no longer capable of living on her own at 90 years of age. Distance was a problem since she lives in Pennsylvania. Her four children are in Virginia, Kentucky, and Indiana. It was touch and go for a while as she stubbornly dug in her heels about leaving her house. Lots of emotional back and forth but she is now in a safe environment. It was an emotional time for everyone involved in the transition.
I have a client that is losing their cognitive ability. They’re in their late 70s and shouldn’t be living alone. The client was in Indiana and her daughter in California. Her daughter has three young children. Both she and her husband work. Mom has sold her house in Indiana and is living with her daughter and family for the time being. It's clear that mom has different expectations than her daughter and son-in-law. There is a conversation that needs to happen. These conversations can be difficult. It’s a tough subject. Open and ongoing communication between adult children and elderly parents is critical.
I have another client with parents in their 70s. Dad is doing fine. Mom is starting to get confused more easily. Mom has let her daughter know that she plans on moving in with them if something happens to dad. Daughter has five young children and works. Mom and Dad are not willing to share financial information with their daughter and her husband. A conversation needs to happen. Mom opened the door by letting daughter know more than once that she plans on moving in if something happens to Dad. It’s worth repeating. Communication between adult children and elderly parents is critical.
Elderly parents often expect help from adult children. They also often fight to hold on to their independence. Often they resist change well past the time for change. Conversations about driving, living arrangements, and finances are difficult but necessary.
All too often the status quo doesn’t give way until a medical emergency forces change. Waiting until a crisis occurs is unnecessary and can be avoided. But it takes planning and open communication between all parties.
Regards,
Christopher R Norwood, CFA
Chief Market Strategist