- Yen carry trade making a comeback
- Slowing inflation means lower corporate revenue growth
- Inflation threatens spending goals in retirement
Market Update
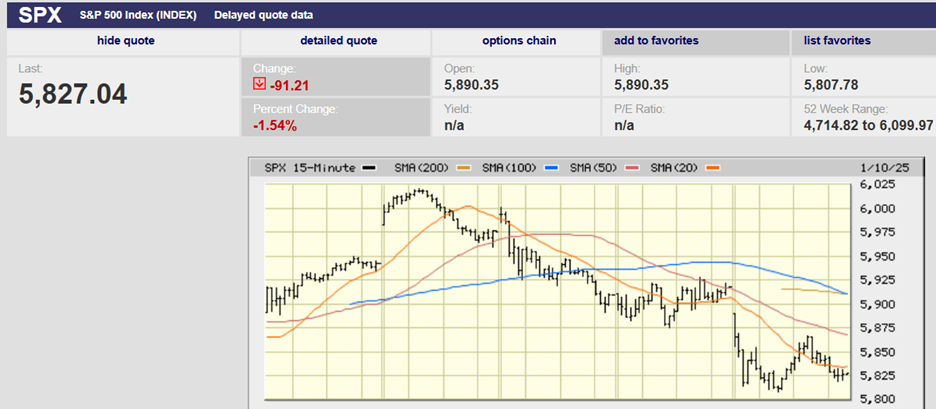
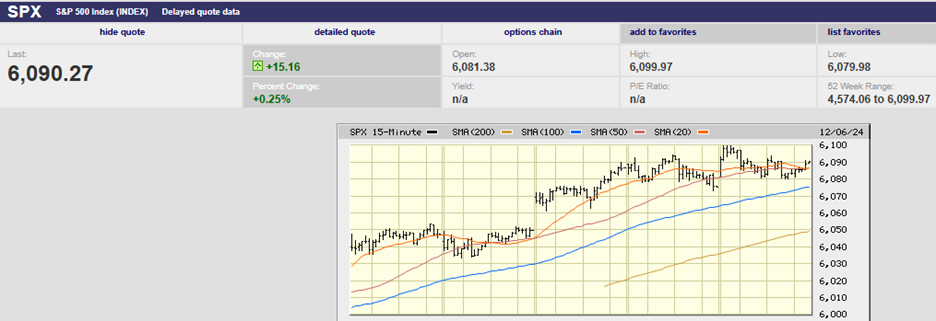
The S&P 500 rocketed higher last week, finishing up 3.9%. It closed at 5,554.25, not far from its all-time high of 5,669.67. The index sliced through resistance as if it wasn’t. The 100-day, 20-day, and 50-day slowed the advance not at all. The 20-day has fallen below the 50-day moving average. It is a sign of short-term weakness. Except the S&P has shown only strength since the 20-day moving average's bearish cross.

S&P 500 10-day Chart
The bullish action has led to a rarity. The S&P has experienced nine higher lows in a row. The streak began on 6 August. Traders will see the momentum as supportive of a further advance in the coming weeks. An attempt to take out the all-time high is almost a given. Unless of course it’s just a short covering rally in a light-volume market. It is August after all, and the A-team is usually on vacation. The junior traders are left manning the trading desks.
Bloomberg believes the reason for the rally lies overseas. It reported Friday morning that the Yen carry trade was coming back with a vengeance. Recall that a carry trade is a funding mechanism. An investor borrows in a low-yielding currency and buys a higher-yielding currency or asset. Investors have been borrowing Yen and converting the currency into dollars. They’ve taken the dollars and bought the Magnificent Seven stocks during the last year plus.
“A popular yen-centered carry trade that blew up spectacularly two weeks ago is staging a comeback. Japan’s currency has weakened more than 5% against the dollar since Aug. 5, when a cocktail of hawkish Japan monetary policy moves, jitters around US earnings and a feeble jobs report catapulted the yen to a seven-month high,” Bloomberg's Mary Nicola reports.
The carry trade narrative explains the surge in volatility during the last few weeks. The VIX did a moonshot to 65.73 a couple of Mondays ago. The volatility index hasn’t risen as high since it peaked around 85 during the early days of Covid. The VIX represents the market’s expectations for the relative strength of near-term price changes. It generates a 30-day forward projection of volatility. Volatility measures how fast prices change. The VIX is a good measure of market sentiment. It reveals the degree of fear among market participants.

VIX 10-year chart
The giant swing in VIX happened the day the S&P fell 3.0%. The volatility index closed at 38.57 that Monday. It slipped below 15 on Friday, only 10 trading days later. Goldman Sachs expects heightened volatility at least until the August 21 VIX expiry. Goldman also pointed out that when VIX moves 10-20 points in a day you are, “generally seeing SPX trade in a 5-10% intraday band… we didn’t even breach a 3% SPX trading range on Monday (5 August).” The fear among investors came and went quickly. In fact, the VIX had its largest eight-day drop ever from August 5th to the 15th.

VIX 2-year chart
Fear and uncertainty lead to heightened volatility. Heightened volatility leads to more fear and uncertainty. The market has been roaring higher since it bottomed on the 5th. We may see a new high and a continuation of the bull market. We may see a double top and a steeper pullback. Investors were quick to panic at a marginally weaker-than-expected jobs number. It is a warning. It won’t take much to cause investors to stampede for the hills once again.
It may be that investors are on edge because the stock market is expensive, and they know it. Regardless of the metric used the S&P is trading well above its long-term average valuation. Valuation isn't a good timing device. Markets can stay expensive for years. High valuations do make for skittish investors though. Expensive markets also limit future upside.
Valuation charts

Price-to-Sales
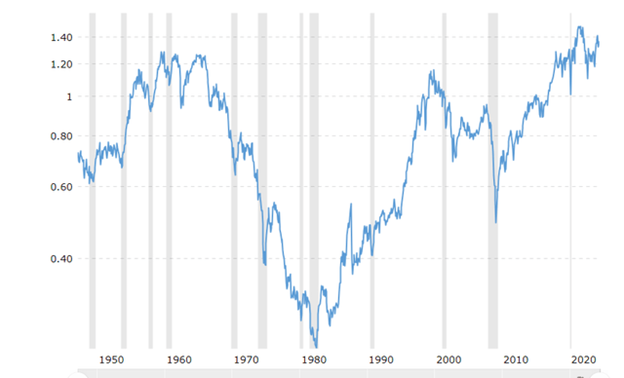
Market Cap to GDP (Warren Buffet’s favorite)

Market Cap to Book Value (Equity in the business)

S&P 500 Dividend Yield going back to the 1870s
There is no question that the S&P 500 is trading at lofty heights. There is no question that ten-year returns will be below the long-term average. Whether a bear market is in the offing is another matter.
Earnings season is winding down. There is evidence that companies are struggling to grow their top line. Slowing inflation means lower nominal GDP growth. Lower nominal GDP growth means lower corporate revenue growth. Home Depot is a good example of the dynamic. It reported earnings last week. Investors were disappointed when it set full-year guidance below expectations. Comparable store sales fell 3.6% during the quarter. The CEO expects comparable store sales to decline between 3% and 4% in 2024 compared to prior guidance of a drop of 1%.
The core CPI was 3.2% year-over-year in July. CPI and Core CPI accelerated month-on-month. Core services CPI accelerated in July also, rising 0.31% or 3.8% annualized. Core CPI rose 0.17% or 2.0% annualized. It was the biggest rise since April.
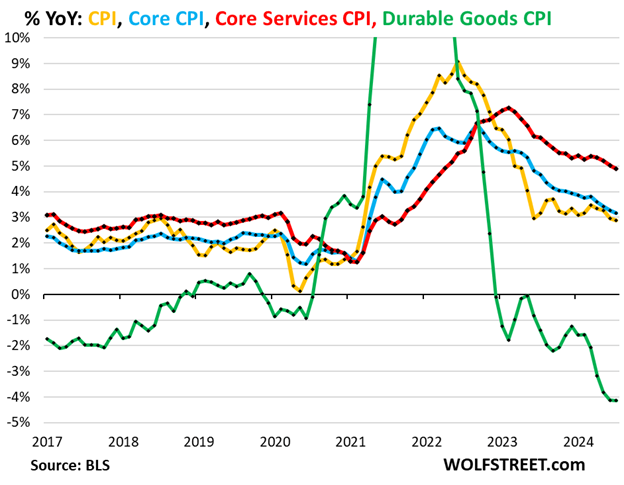
CPI (yellow line) is falling, but not very fast. Core Services CPI (red line) rose by 4.9% year-over-year in July. That can’t make the Fed happy. The Fed will need to move slowly as it begins its rate cut cycle. It’s not at all clear that inflation is whipped. Watch out if durable goods CPI (green line) stops its historic fall.
Meanwhile, rate cuts won’t impact the economy any time soon. Long and variable lead times apply both as the Fed tightens and loosens. Investors are hoping that Fed rate cuts will juice earnings in the coming quarters. They are likely to be disappointed.
Risk management is still the priority. The next six to twelve months could prove very interesting for investors.
Economic Indicators
The economic data is always something of a Rorschach test. People tend to see what they want to see. Last week Wall Street saw positive news. The NFIB optimism index was the highest since February of 2022. Economists highlighted that fact. Yet it was also the 31st consecutive month below the 50-year average of 98. “Cost pressures, especially labor costs, continue to plague small business operations,” wrote NFIB Chief Economist Bill Dunkelberg. The NFIB went on to highlight some other disturbing trends in the report. “Of the 57% of owners hiring or trying to hire in July, 86% reported few or no qualified applicants for the positions they were trying to fill.”
Other findings included:
- Twenty-five percent of owners reported that inflation was their single most important problem.
- The frequency of reports of positive profit trends was a net negative 30% (seasonally adjusted), one point worse than June.
- Nineteen percent said that labor quality was their top business problem, remaining behind inflation as the number one issue.
Also last week the core Producer Price Index (PPI) came in higher than expected at 0.3% for July. It rose 0.1% the prior month. Core PPI year-over-year rose 3.3%, faster than the prior months 3.2% annual gain. PPI feeds into CPI. The Core CPI rose 0.2% in July, up from 0.1% the prior month. Core CPI rose 3.2% year-on-year, a slower rate than the prior months 3.3%. The headline number slowed to 2.9% from 3.0%. Encouraging but only a very slow improvement since June of 2023.

A drop in weekly initial jobless claims and a 1% increase in retail sales were touted last week as signs of economic strength. Yet, retail sales minus autos rose only 0.4%, below the 0.6% forecast. Auto sales are excluded because of their volatility. It’s like reporting core CPI, which excludes food and energy. The idea is to better identify the trend by eliminating some of the noise. Meanwhile, initial jobless claims continued in a rising trend.

Neither report provided much evidence of a strengthening economy. The Atlanta Fed GDPNow tool is forecasting 2.0% GDP growth for Q3, down from 2.8% growth a few weeks ago. Norwood Economics expects the forecast to continue falling. We think it likely the economy will fall into recession in the next six months or so.
Higher Inflation is Here to Stay
I’ve had several conversations with clients recently about higher for longer inflation. Financial planning is affected by the inflation rate assumed. Spending goals are easier to achieve if inflation is low. Use an inflation rate that is too low and watch your spending goals crumble as your retirement unfolds. Inflation half a point higher than expected over a 25-year planning horizon has a big impact on your financial plan.
The real rate of return is what matters to an investor. Earn 2% while inflation is rising 5% and see how long you can fill your cart full of groceries. Purchasing power is destroyed. A bond investment that pays 4% with inflation at 2% has a real return of 2%. That real return gives you more purchasing power.
Inflation-protected bonds (TIPS) have been around since 1997. Their principle is adjusted for inflation (Using the CPI-U). Buy a bond for $1,000 with inflation running at 3%. A year later the bond is marked up to $1,030. Investors get their principal back along with the inflation adjustments at maturity. They also collect the coupon along the way.
The five-year breakeven inflation rate is 1.97%.

The 10-year breakeven is 2.08%.

The breakeven rate is the inflation rate that gives an investor the same real return as a regular Treasury bond. Investors expect inflation to fall to around 2% and stay there for at least the next ten years. Investors holding TIPS win if inflation runs hotter than the breakeven rate. Traditional Treasuries win if inflation is lower than the breakeven rate. Norwood Economics is on record as believing that inflation will be higher for longer. The debt and ongoing deficits make it likely. The U.S. government needs higher inflation to cope with the growing mountain of debt on its balance sheet.
There are some structural reasons for expecting inflation to be a problem in the coming decades. Deglobalization is inflationary. Those supply chains were created for one reason and one reason alone – to reduce costs. Deglobalization means higher costs for businesses. Those costs will be passed on to consumers. The transition to renewable energy requires significant costs. Another inflationary force. Military spending is trending higher. It will likely continue to do so for the foreseeable future. Military spending is another call on finite resources. Prices will rise. Restrictions on immigration is another inflationary force. The U.S. is aging. Its workforce growth is slowing. We need immigrants to increase the supply of labor to meet demand for labor. Insufficient supply means higher labor costs all else equal.
“If there is one major economic theme in the next three to five years, it’s the risk that we will see permanent upside pressure on inflation,” writes Torsten Slok recently. Slok is chief economist at Apollo Global Management. He spent 15 years at Deutsche Bank before that and has also done stints at the OECD and IMF.
Higher for longer inflation is likely. TIPS are an important tool for investors. They help investors diversify while also hedging against unexpected inflation.
Regards,
Christopher R Norwood, CFA
Chief Market Strategist