- The Stock Market is Expensive
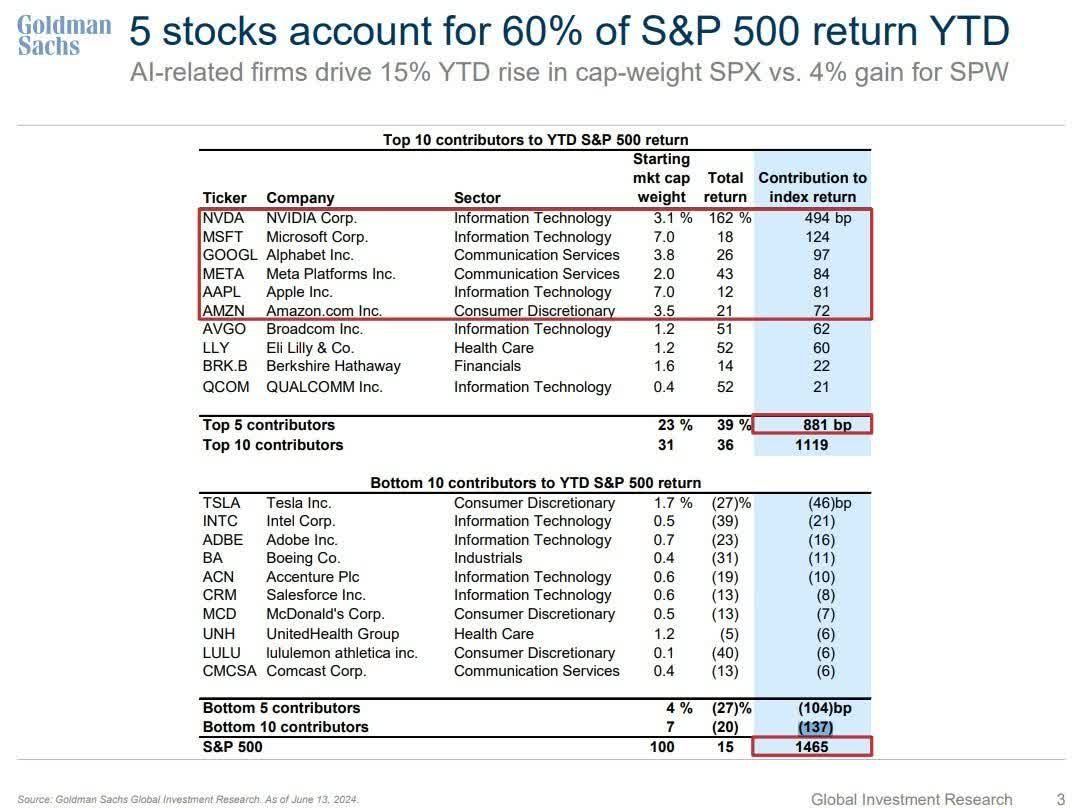
- Only a Handful of the Stocks Represent the Bulk of the Gains
- Future Returns Likely to be Muted

Market Update
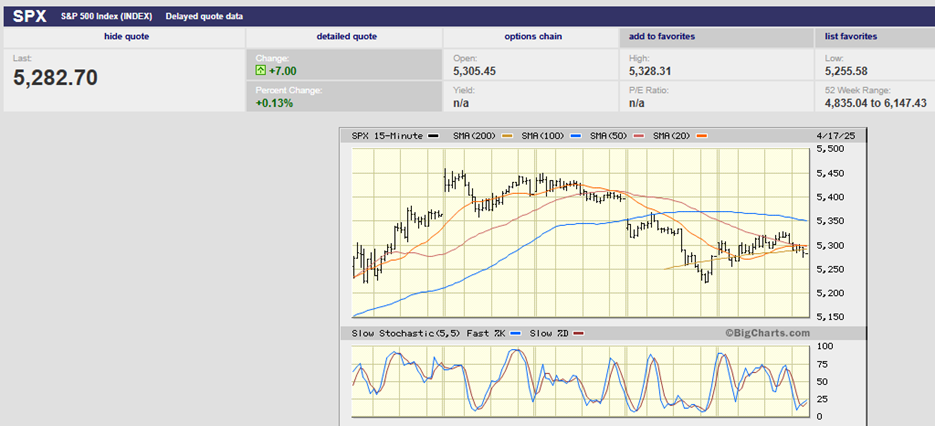
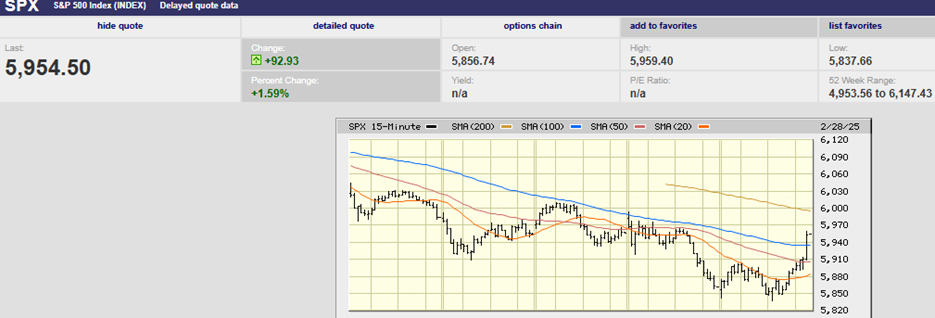
The S&P 500 rose 0.6% to 5,464.62 last week. The bull market marches on with the S&P setting a new high of 5,505.53 in the process. There was something different about last week though. The prior two weeks saw early intraday lows and late highs. They also saw a market that advanced during the week. Not last week. Last week the S&P made all its gains and then some by Monday’s close. The S&P finished Monday at 5,473.23. It lost 0.16% the rest of the week. Further, Monday’s gains came on no significant news. The lack of follow-through after Monday's gains may be significant. Buyers may be done buying for a while. A pullback in the coming week wouldn’t be a surprise. The 20-day moving average is around 5,355. The 50-day moving average is around 5,230.
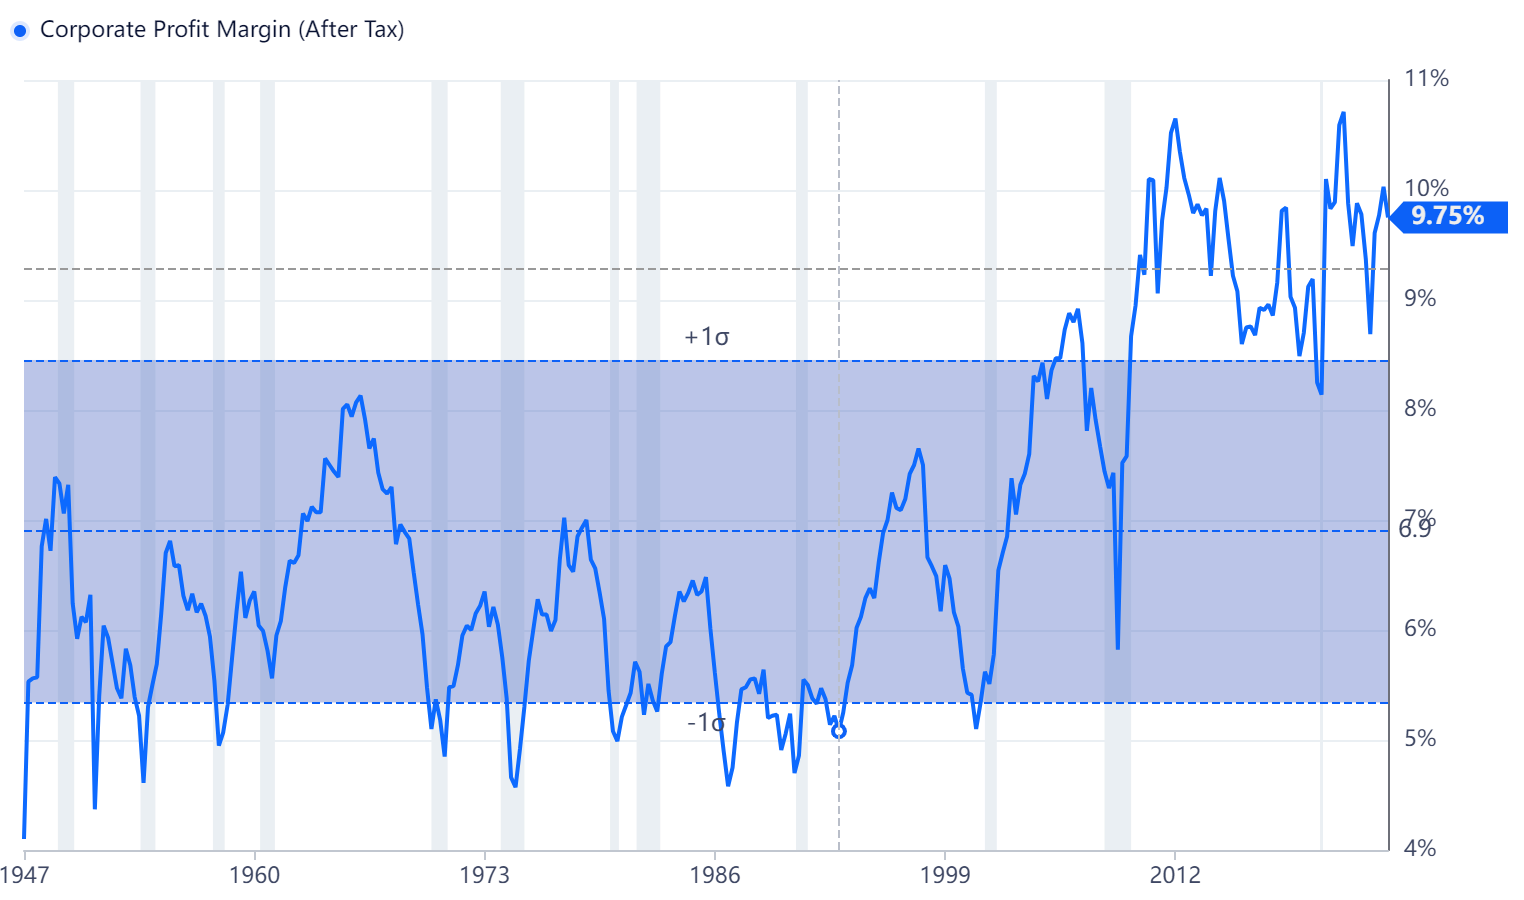
The 10-year Treasury yield rose to 4.26% from 4.22% the prior week. The two-year yield rose to 4.75% from 4.73%. The latest Atlanta Fed GDPNow forecast is for 3.0% growth in Q2. The consensus earnings growth forecast for 2024 is 9.8%. Earnings growth estimates are back-end loaded with expected Q4 growth of 14.2%. Earnings growth of 14.0% is forecast for 2025. Nominal GDP growth will be around 5.5% in 2024. That estimate is based on the Fed’s guess of 2.1% real GDP growth and an inflation estimate of 3.5% for 2024. Corporate profit margins will need to expand. The only way to grow earnings by 9.8% in 2024 given 5.5% nominal GDP growth is with margin expansion.
Corporate margins are already high. Corporate profit margin (After Tax) was 9.75% as of 01-01-24 according to the Bureau of Economic Analysis (BEA). Historically corporate profit margins have been around 6.5%. The economy is slowing. It seems unlikely that profit margins will rise further. Earnings growth in 2024 is more likely to be in the mid-single digits (or lower) rather than the 9.8% consensus.
And earnings growth hasn’t been very good after excluding a handful of large tech companies, according to money manager Bret Jensen. He points out that profits have declined in Q4 2023 and Q1 2024 for most companies. Jensen wrote recently that, “The market is currently priced at 22 times forward S&P 500 earnings per share. Taking out the seven largest tech names, profits have fallen across the index on a year-over-year basis for the last two quarters.” He went on to write that, “Again, this is not a sign of a healthy market or economy.”
The concentrated earnings growth explains the concentrated market returns.
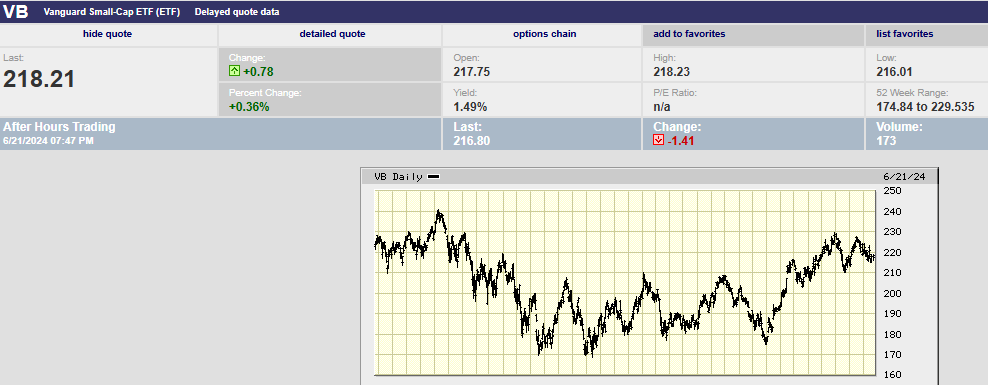
Small-cap and mid-cap stocks are still below their highs set in the fall of 2021.
3-year Small-Cap Index Performance

3-year Mid-Cap Index Performance
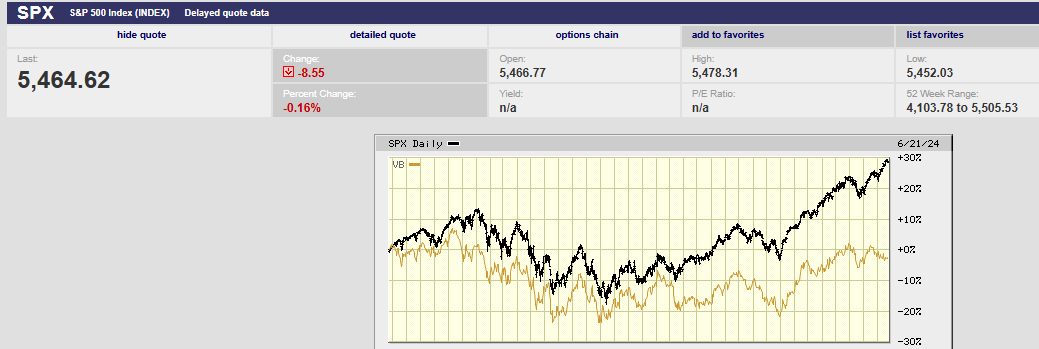
The S&P is up 30% over the trailing three years. The equal weight S&P is up only 10%. The equal-weight S&P is averaging returns of barely 3% per year. Investors have earned more in safe, liquid money market funds.
3-year chart
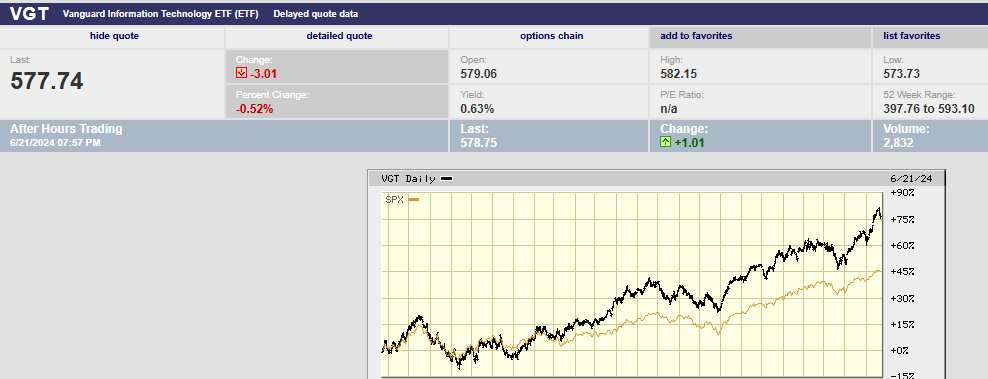
Much of the S&P performance over the last year or so is coming from technology, mega techs in particular. The Vanguard Information Technology ETF is up 75% over the trailing two years. The S&P 500 is up “only” 45%.
2-year S&P vs VGT chart
Market internals have been deteriorating since mid-May, according to Christopher Yates, CFA. He writes that, “only 34% of the S&P 500’s constituents are trading above their respective 20-day moving averages, while the index trades at all-time highs.”

Yates also points out that, “similar breadth indicators from a longer-term perspective are equally weak.” He's referring to both the 50-day and 200-day moving averages. Also, to the equal weight S&P 500 against the S&P 500.

The stock market is one of the Consumer Conference Board’s leading indicators. The market has lots to say about the strength of the economy. The consumer cyclical sectors are signaling economic weakness.

Yet money manager bullishness has hit a 2 ½ year high, according to the BofA June Fund Manager Survey. BofA surveyed 238 panelists with $721B in assets under management. The sentiment measure is based on cash levels, equity allocation and economic growth expectations. It has risen to its highest level since November 2021. Only 5% of the managers surveyed expect a hard landing. Those expecting a soft landing have risen to 64%. The no landing contingent has fallen to 26%. More than 50% of panelists expect no recession in the next 18 months. Money managers expecting two, three, or more rate cuts has risen to 78%.

"'Long Magnificent 7' (AAPL) (AMZN) (GOOG) (GOOGL) (META) (MSFT) (NVDA) (TSLA) remains the most crowded trade for the 15th consecutive month and is now the most crowded trade at 69%," BofA strategist Michael Hartnett wrote. "There have only been a handful of times when a single trade was more crowded in FMS history ...”
Meanwhile, financial journalist James Picerno writes that, "it's also clear that the trailing 10-year return for the S&P 500 is elevated. U.S. stocks appear overextended." He also writes that, “The 10.9% annualized gain for the index is currently at the 75th percentile.” Picerno suggests in his article that investors may want to reduce stock exposure and increase bond exposure.

The S&P 500 is expensive because of the above-average returns experienced since 2010.
Market Cap to GDP is reportedly Warren Buffet’s favorite measure. The current ratio may explain why Buffet is sitting on record amounts of cash instead of investing it.

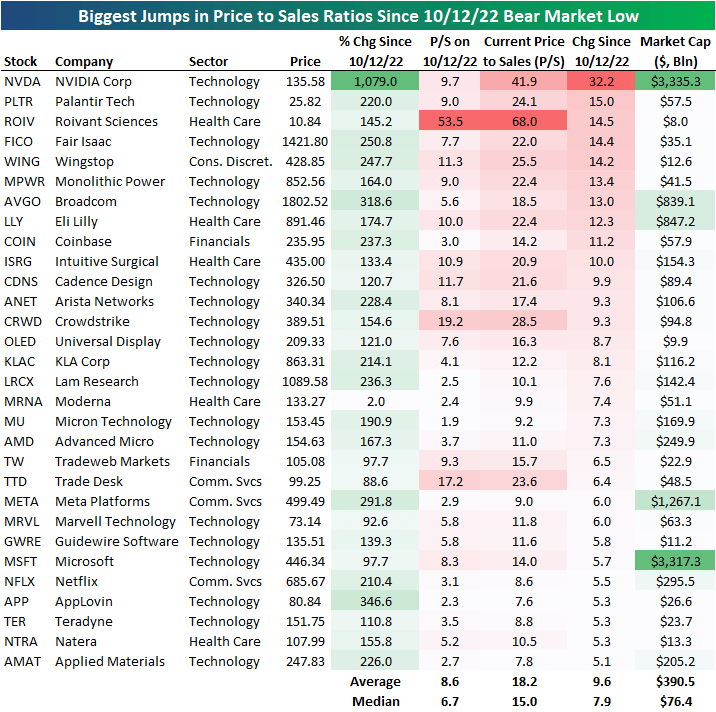
Price-to-Sales is another reliable indicator of how cheap or expensive the stock market is. The Tech sector has led the charge higher.

And it’s only a relative handful of tech stocks that have seen P/S explode higher.
Aggressive earnings growth estimates. Exuberant money managers. A concentrated market advance. A crowded mega-cap tech trade. An S&P 500 that has produced outsize returns over the last 10-years. Throw it all into the pot, stir well. It is a recipe for stock market disappointment. The question is when does it start?
Risk is higher than normal. Risk management remains the priority. Avoiding big losses is more important than participating in big gains.
Economic Indicators
The U.S. leading economic indicators index fell 0.5% in May. It fell 0.6% the prior month. It was the third decline in a row. “The U.S. LEI fell again in May, driven primarily by a decline in new orders, weak consumer sentiment about future business conditions, and lower building permits,” according to the Conference Board. The coincident economic index (CEI) rose 0.4%. The Conference Board said that the LEI was not predicting recession.
Retail sales came in weaker than expected. They rose 0.1% in May below the 0.2% forecast. Still, it was an improvement over last month’s 0.2% decline. Retail sales excluding autos were down 0.1%, well below the forecast of 0.2%. MarketWatch blamed inflation and high interest rates.
Initial jobless claims clocked in at 238,000 down from 243,000 the prior week. The housing market continued to struggle. Housing starts fell to 1.28 million from 1.35 million in April. Building permits were 1.39 million in May, down from 1.44 million. Expectations were for 1.45 million permits issued. Existing home sales were 4.11 million in May, down from 4.14 million. Interest rates and home prices continue to weigh on housing.
The S&P flash services PMI was stronger than expected at 55.1 up from 54.8. The S&P flash manufacturing PMI was also stronger than expected at 51.7 up from 51.3.
All in all the economic data out last week doesn’t give the Fed a reason to cut rates.
Estate Planning
Estate planning questions popped up last week. A 401k participant in Ft Wayne had a question about her mom’s trust. Her mom passed away around three years ago. The 401k participant was a trustee along with her brother and uncle. There’d been delays in distributing assets due to disagreements among the trustees. Think carefully about who you’d like to have as a trustee. Too many trustees can result in problems administering a trust.
Another 401k participant asked about estate planning attorneys last week, also for her mom. Her mom lives alone, and her health is deteriorating. She doesn't have a Will, durable power of attorney or health representative. I passed along contact information for three estate planning attorneys. I also suggested that she start a conversation with her mom about the importance of estate planning. I added that doing a walkthrough of her home to identify tripping hazards should be a priority. Falls are the silent killer of seniors. The 401k participant lives a couple of hours away from her mom. It sounds like a situation that needs some planning sooner rather than later.
And I had lunch with an estate planning attorney last week as well. It was coincidental, having been on my calendar for a month. We talked a bit about both situations. I mentioned my surprise at how many people don’t have Wills. The estate planning attorney told me that about 70% of people don’t. That’s a shocking number. Dying without a Will (intestate) can cause all sorts of problems. And even without a Will someone has to manage the estate and figure out how property should be distributed. Any one of the heirs usually opens the probate estate with the local court if a Will is lacking. My estate planning attorney colleague informed me that whoever filed first with the court to serve as the estate administrator usually got the job. She referred to it as a “race to the courthouse”.
Estate planning can save people a lot of heartache and emotional turmoil. Everyone needs to do estate planning.
Regards,
Christopher R Norwood, CFA
Chief Market Strategist