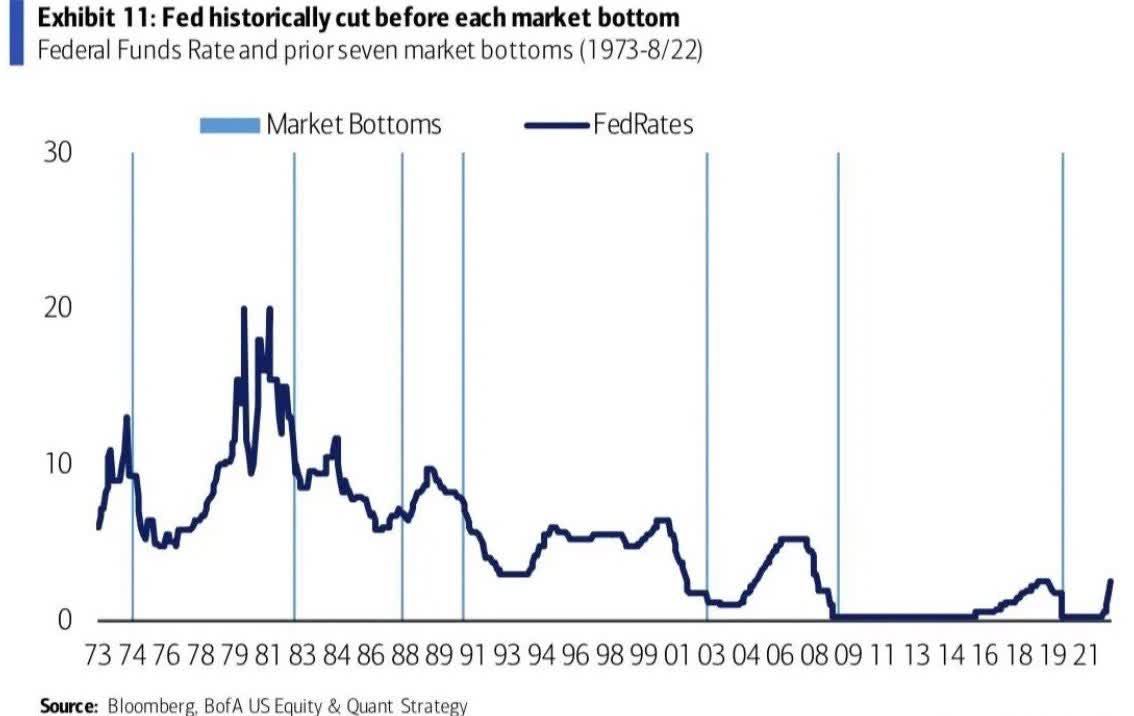
Fed rate cuts don’t come until after the stock market has tanked
Market Update
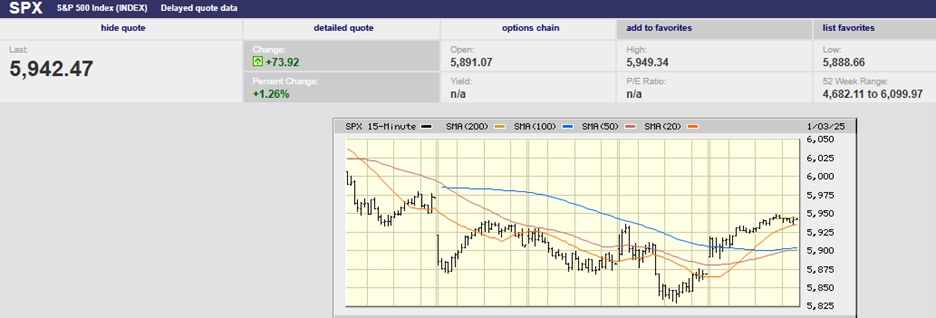
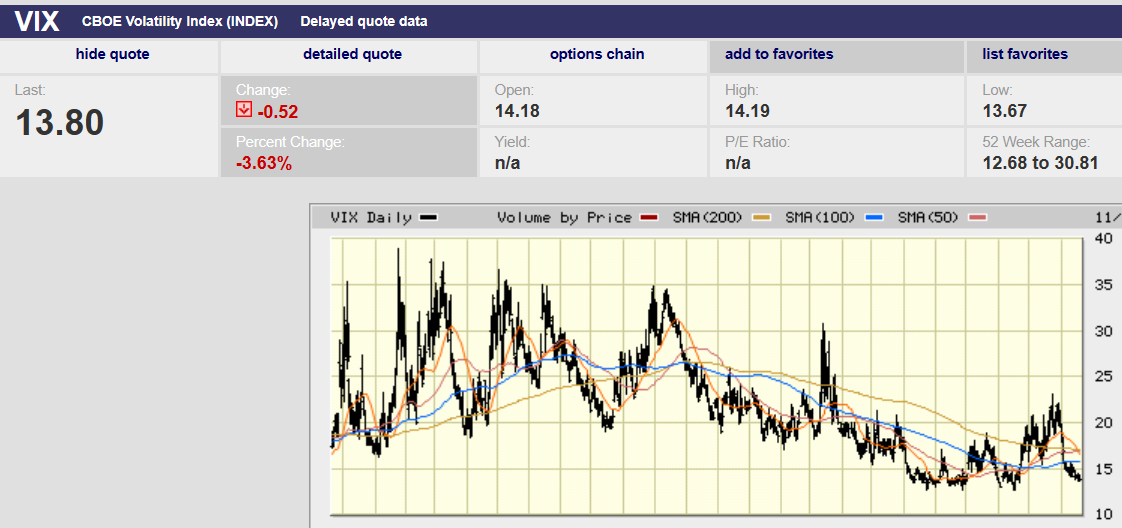
The S&P 500 rose 2.24% last week to finish at 4,514.02. The Nasdaq rose 2.4%. The 10-year Treasury yield ended the week at 4.48% and the two-year Treasury yield closed the week at 4.91%. The melt-up from 4,100 over the last three weeks is the largest three-week gain since 2020. The 10% move was accompanied by a drop in the Volatility (VIX) index to 13.84 by Friday. Volatility has collapsed by some 40% over the last three weeks. It can fall further. The VIX routinely hit 10 in 2014 and 2017. But the current level is at the low end and signals investor confidence. They expect the market to continue higher.
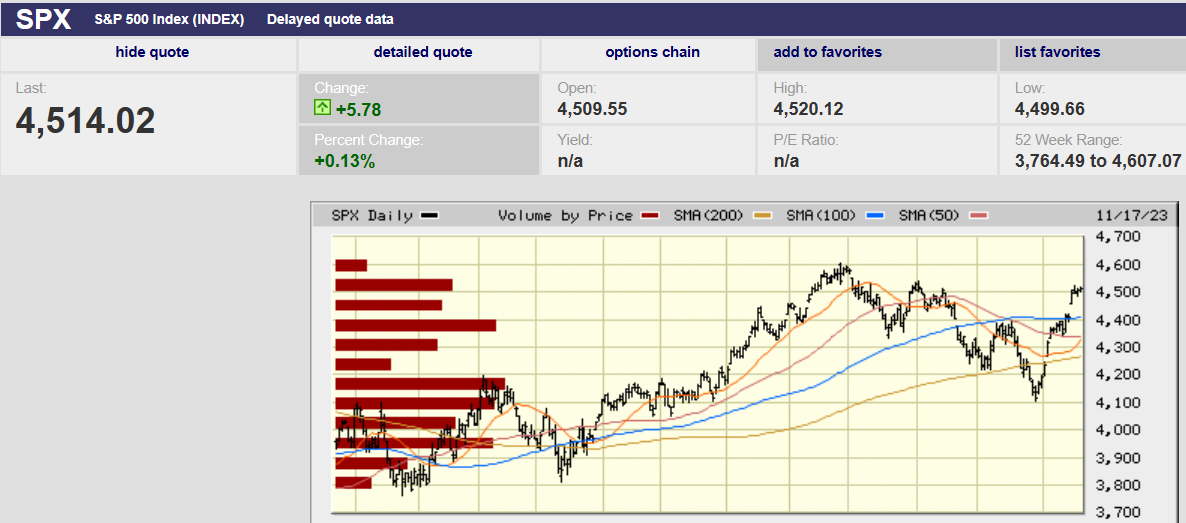
The S&P put in a three-day top to end the week. Oscillators are rolling over and the index is short-term overbought. Normally a pullback would be in order. Perhaps a 2% to 3% decline to close the gap left from 4,411 to 4,460. Or a larger decline of 3.7% back to the 50-day moving average at 4,345. But momentum is strong. The 52-week high is only 2% away. And the (almost always) Christmas rally is right around the corner. The odds favor at least an attempt to take out the 52-week high. It is a holiday-shortened week with volume fading into Thursday. Markets can jump around in light volume. It will be an interesting week. Don’t be surprised if the S&P makes a new 52-week high before it is over.
The three-week rally in stocks is courtesy of the bond market. Falling interest rates are giving investors hope that the Fed is done hiking, and a soft landing is coming. Of course, falling interest rates occur prior to a hard landing as well. Interest rates are falling because the Treasury reduced borrowing at the long end of the yield curve. Also, weaker-than-expected jobs data for October encouraged bond buying. As well, we got a lower-than-expected CPI number. As a result, investors are pricing in an end to the Fed rate hike cycle. They are also pricing in four rate cuts in 2024, the first in May. A slowing economy that doesn’t fall into recession is the hope. Somehow earnings are expected to rise by more than 11% in that slowing environment.
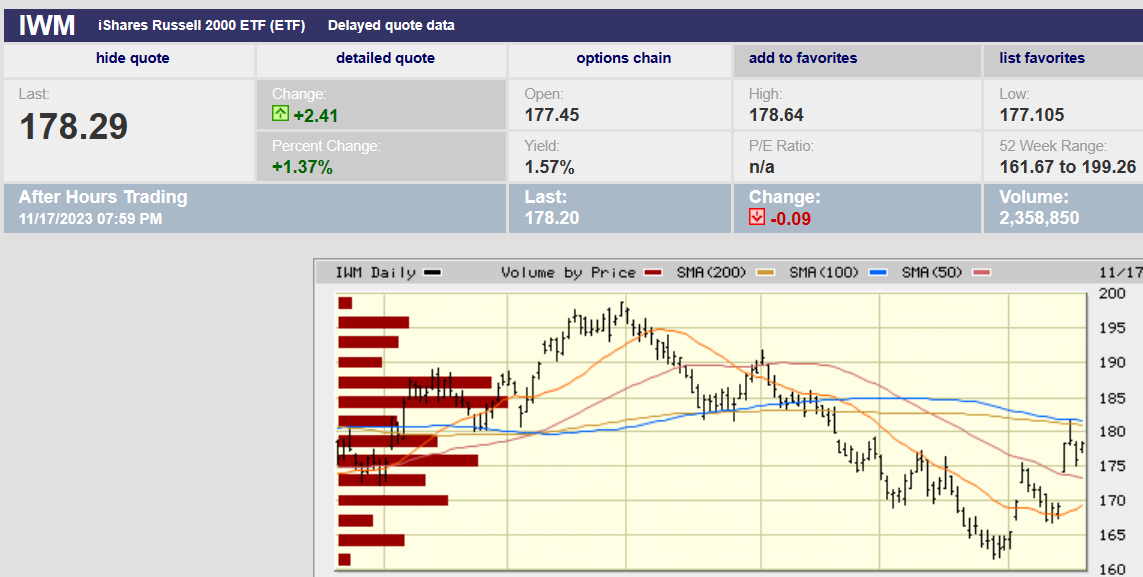
Next year’s earnings are a problem. An expensive market is a problem. Short-term is more about algorithms, technical levels, and zero-sum trading. A large part of the move higher in stocks has been short covering. It has not been buying based on improving fundamentals. One need only look at the large gaps left behind during the S&P 500’s meltup for evidence of short covering. Last week it was the Russell 2000 small cap index (IWM) that screamed higher on short covering. It gapped up big at the open and rose 6% the day the CPI was reported. The IWM has high short interest.
Longer term it is fundamentals that matter. And fundamentals heading into 2024 are deteriorating. For instance, the jobs market showed evidence of weakening last week as initial jobless claims rose to 231,000. It is the highest jobless claims rate since August 27th. It is well above the 200,000 initial jobless claims in the week of 14 October. Crude started to sell off when the jobless claims number was released. Crude fell 5% on the day from $76.2 per barrel to $73 per barrel. Crude oil peaked not that long ago at $95 per barrel. It may be that energy traders are starting to worry about recession.
Part of the narrative for a higher market is tied to expected rate cuts. The problem with the narrative is that the Federal Reserve over the last 25 years has never cut rates until after a spike in credit spreads. Stress in the credit market has typically undermined stocks. Consequently, Fed rate cuts don’t come until after the stock market has tanked. Credit spreads are holding in well currently. The ICE BofA US High Yield Option-Adjusted Spread is 4.02% as of 16 November. The average spread over Treasuries is more like 5.5%. The Fed is unlikely to start cutting rates until credit spreads start to widen. Stocks are likely to be falling when that occurs. In fact, the stock market doesn't bottom until after the Fed starts cutting rates.
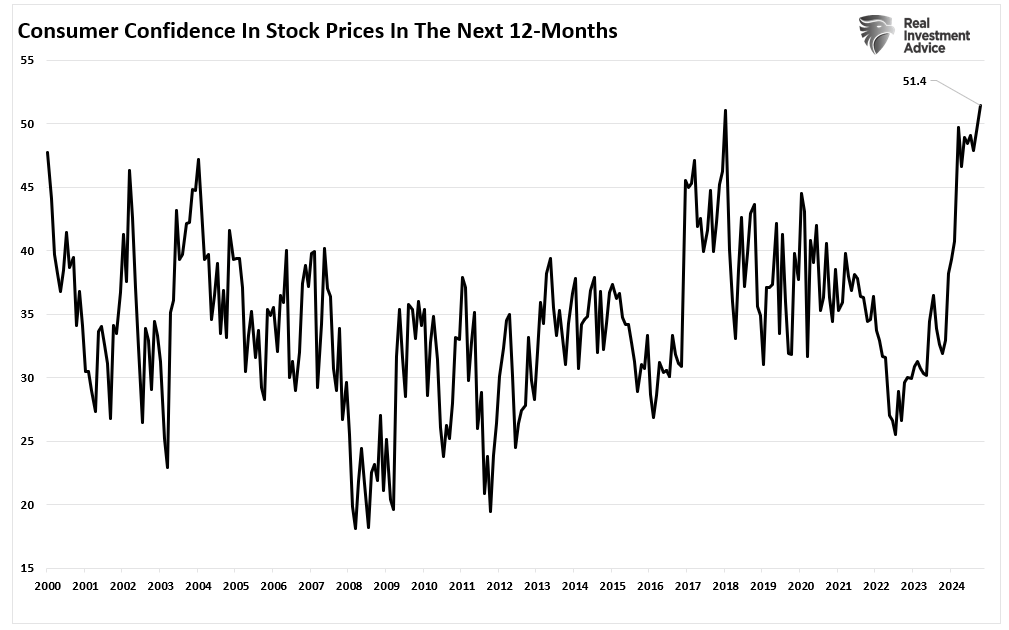
The Federal Reserve is also constrained from making rate cuts by the obvious. Inflation is still running well above the 2% target. Further, there’s reason to believe that inflationary pressures are here to stay. Higher for longer inflation is expected by the Consumer Conference Board. Dana Peterson is chief economist at the Conference Board. He wrote recently that the Conference Board expects inflationary pressures to stick around. Onshoring, nearshoring, and friend shoring will increase supply-side inflationary pressures. Labor shortages will lead to upward pressure on wages. Prices will need to rise to account for higher labor costs or profit margins will fall. Roughly 155 million millennials and Generation Zers will reach peak homebuying age over the next 20 years. Demand for homes is likely to outstrip supply, putting upward pressure on prices. The renewable energy transition will be costly and will add to price pressures as well. Structural changes in the U.S. and world economies point to higher inflation in the coming decades.
The Federal Reserve is likely to take a conservative approach to inflation. Investors should believe the Fed’s higher for longer mantra. The Fed’s Summary of Economic Projections (SEP) is indicating one more rate hike in 2023 and two rate cuts in 2024. We won’t see the rate hike this year. Only two rate cuts next year is the current Fed forecast. Two rate cuts is more likely than the four cuts investors are expecting.
Expect a rally into year-end. Expect a resumption of the trading range stock market in 2024.
Economic Indicators
Inflation was the big news last week. The headline number was flat thanks in part to cheaper gas. It was the smallest increase in 15 months. Core consumer prices rose 0.2%, below the expected 0.3% forecast. The core CPI year-over-year rose 4.0%. More good news came on Wednesday as the core PPI rose less than expected. The 0.1% rise was below the 0.3% forecast. PPI leads CPI.
The futures market is pricing in four 25-basis-point cuts by the end of 2024. The case for cuts was furthered by a weak retail sales number. U.S. retail sales fell 0.1% in October. It was well below the 0.9% increase forecast. Retail sales minus autos rose 0.1%, well below the expected 0.9%. Autos and housing are the two most interest rate-sensitive sectors of the economy. There was more weak news out on Thursday. Industrial production fell 0.6% in October. Economists were forecasting a 0.4% decline.
Leading indicators are pointing to recession. Coincident indicators aren't there yet. The CEI is up 1.1 percent over the six-month period between March and September 2023. It rose 0.4 percent over the previous six months.
Equity Wedges
We write about the short-term movements of the stock market for two reasons. The first is that doing the research helps me understand the investing environment. Knowing whether a stock is falling because of long-term fundamentals or short-term noise is important. We don’t want to sell stocks that are falling because of short-term noise. The second reason we write about the short term is because people want to know what might happen next week and next month. And I want people to read our newsletter! (Shocking I know).
It's the norm that most people judge the quality of their stock investments by short-term performance. Specifically, whether its risen or fallen since it was purchased. I make a point of asking clients if they have any questions about any of their stocks as part of our annual review. The clients who do want to know about a stock invariably ask about the ones that have fallen since we bought them. It is normal for the stocks we buy to show losses for the first six to twelve months after purchase. Good companies go on sale when their stock prices fall. It is no easier to time individual stocks than it is to time the market. It is quite common for a client to label a stock bad because we’ve lost money. I’ll never forget the time a client told me I’d, “sold all the good stocks and kept all the bad.” What I’d done was take profits in oil companies that were up 100% to 200% since they were bought. The companies were no longer undervalued, and it was time to move on. Risk management is important. The “bad” stocks were stocks that hadn’t gone up, at least not yet.
So what does the above have to do with equity wedges? Not a lot other than that one of our worst-performing stocks is an equity wedge. And most clients ask about the stock when we have our reviews. We’ve continued to buy it because the fundamental story is intact. Management is doing exactly what it said it would do. The stock is worth much more than its current price. Does that mean the stock will recover to its initial buy price? Not necessarily. I like the odds though. We’ve owned the stock for over a year. I expect the story to play out over the next two to three years. The final report card on the investment won’t be known until 2025 or 2026. Long-term investing requires patience among other things. An initial loss in a stock doesn't make it a bad investment.
Regards,
Christopher R Norwood, CFA
Chief Market Strategist